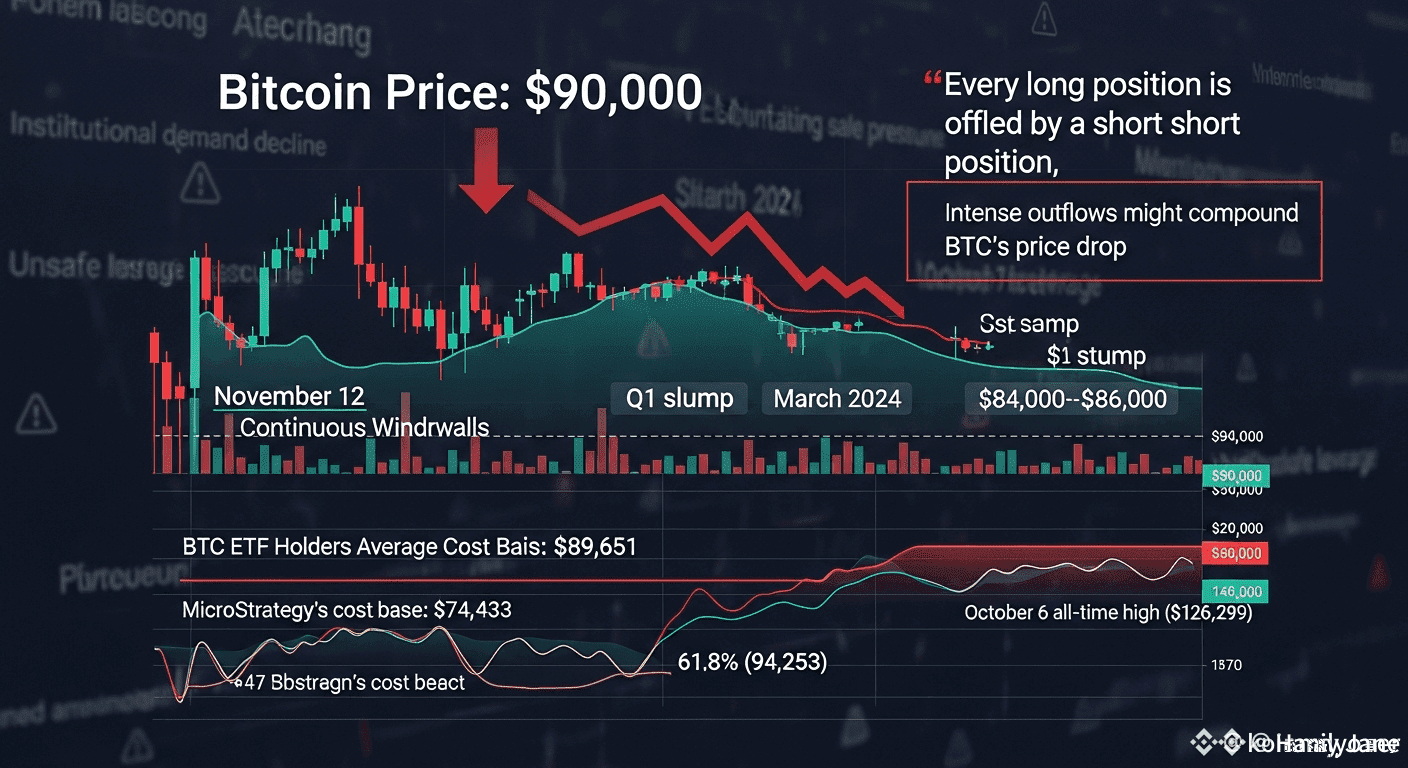
📉 Historical Comparison: If Q1's decline is repeated, BTC will drop to the 84,000–86,000 range
Looking back at the previous two major declines:
During the Q1 tariff panic: Bitcoin dropped by 31.95%
March 2024: Bitcoin dropped 33.57% from its historical high
If the market replicates a similar decline,
Bitcoin will directly crash towards the 84,000–86,000 USD area.
K33 pointed out: The leverage recovery speed in the futures market is very fast,
which may push the price further towards deeper declines📉 Historical Comparison: If Q1's decline is repeated, BTC will drop to the 84,000–86,000 range
Looking back at the previous two major declines:
During the Q1 tariff panic: Bitcoin dropped by 31.95%
March 2024: Bitcoin dropped 33.57% from its historical high
If the market replicates a similar decline,
Bitcoin will directly crash towards the 84,000–86,000 USD area.
K33 pointed out: The leverage recovery speed in the futures market is very fast,
which may push the price further towards deeper declines📊 Key cost price breached: Institutions are under pressure
The chart shows:
Average cost for Bitcoin ETF holders: $89,651
BTC dropped to a minimum of: $89,183 on Tuesday (briefly below)
This means:
Institutions generally are already “not making money”, and even starting to incur losses.
In the Q1 major decline, BTC stabilized and rebounded only after dropping near the ETF cost area.
Now, this price level has become a key “line of life and death.”
Additionally:
MicroStrategy's average cost price: $74,433
Corresponding to the market low on April 7, 2025
If the market continues to deteriorate, this will become a deeper support area.🔎 Technical Aspect: BTC has broken through key Fibonacci support
Currently, Bitcoin:
Retreated from a high of $126,299
Has broken below the 61.8% golden ratio level ($94,253)
Dropped to a minimum of $89,253 on Tuesday
Finally forced back to $92,960
On Wednesday, the price maintained around $91,300.
If the psychological barrier of 90,000 holds:
👉 There is a chance to rebound back to the 61.8% retracement level of $94,253.
If it falls below this level again and closes underneath:
👉 It is highly probable to continue plummeting towards $85,000
which is the next strong support on the daily chart.🔥 Conclusion: Bitcoin is hovering on the edge of life and death
📉 Huge pressure above
📉 Institutional exits are evident
📉 Leverage risks are accumulating
📉 Key technical levels have been lost
As long as $90,000 is lost
Looking back at the previous two major declines:
During the Q1 tariff panic: Bitcoin dropped by 31.95%
March 2024: Bitcoin dropped 33.57% from its historical high
If the market replicates a similar decline,
Bitcoin will directly crash towards the 84,000–86,000 USD area.
K33 pointed out: The leverage recovery speed in the futures market is very fast,
which may push the price further towards deeper declines📉 Historical Comparison: If Q1's decline is repeated, BTC will drop to the 84,000–86,000 range
Looking back at the previous two major declines:
During the Q1 tariff panic: Bitcoin dropped by 31.95%
March 2024: Bitcoin dropped 33.57% from its historical high
If the market replicates a similar decline,
Bitcoin will directly crash towards the 84,000–86,000 USD area.
K33 pointed out: The leverage recovery speed in the futures market is very fast,
which may push the price further towards deeper declines📊 Key cost price breached: Institutions are under pressure
The chart shows:
Average cost for Bitcoin ETF holders: $89,651
BTC dropped to a minimum of: $89,183 on Tuesday (briefly below)
This means:
Institutions generally are already “not making money”, and even starting to incur losses.
In the Q1 major decline, BTC stabilized and rebounded only after dropping near the ETF cost area.
Now, this price level has become a key “line of life and death.”
Additionally:
MicroStrategy's average cost price: $74,433
Corresponding to the market low on April 7, 2025
If the market continues to deteriorate, this will become a deeper support area.🔎 Technical Aspect: BTC has broken through key Fibonacci support
Currently, Bitcoin:
Retreated from a high of $126,299
Has broken below the 61.8% golden ratio level ($94,253)
Dropped to a minimum of $89,253 on Tuesday
Finally forced back to $92,960
On Wednesday, the price maintained around $91,300.
If the psychological barrier of 90,000 holds:
👉 There is a chance to rebound back to the 61.8% retracement level of $94,253.
If it falls below this level again and closes underneath:
👉 It is highly probable to continue plummeting towards $85,000
which is the next strong support on the daily chart.🔥 Conclusion: Bitcoin is hovering on the edge of life and death
📉 Huge pressure above
📉 Institutional exits are evident
📉 Leverage risks are accumulating
📉 Key technical levels have been lost
As long as $90,000 is lost