✅ Current Snapshot
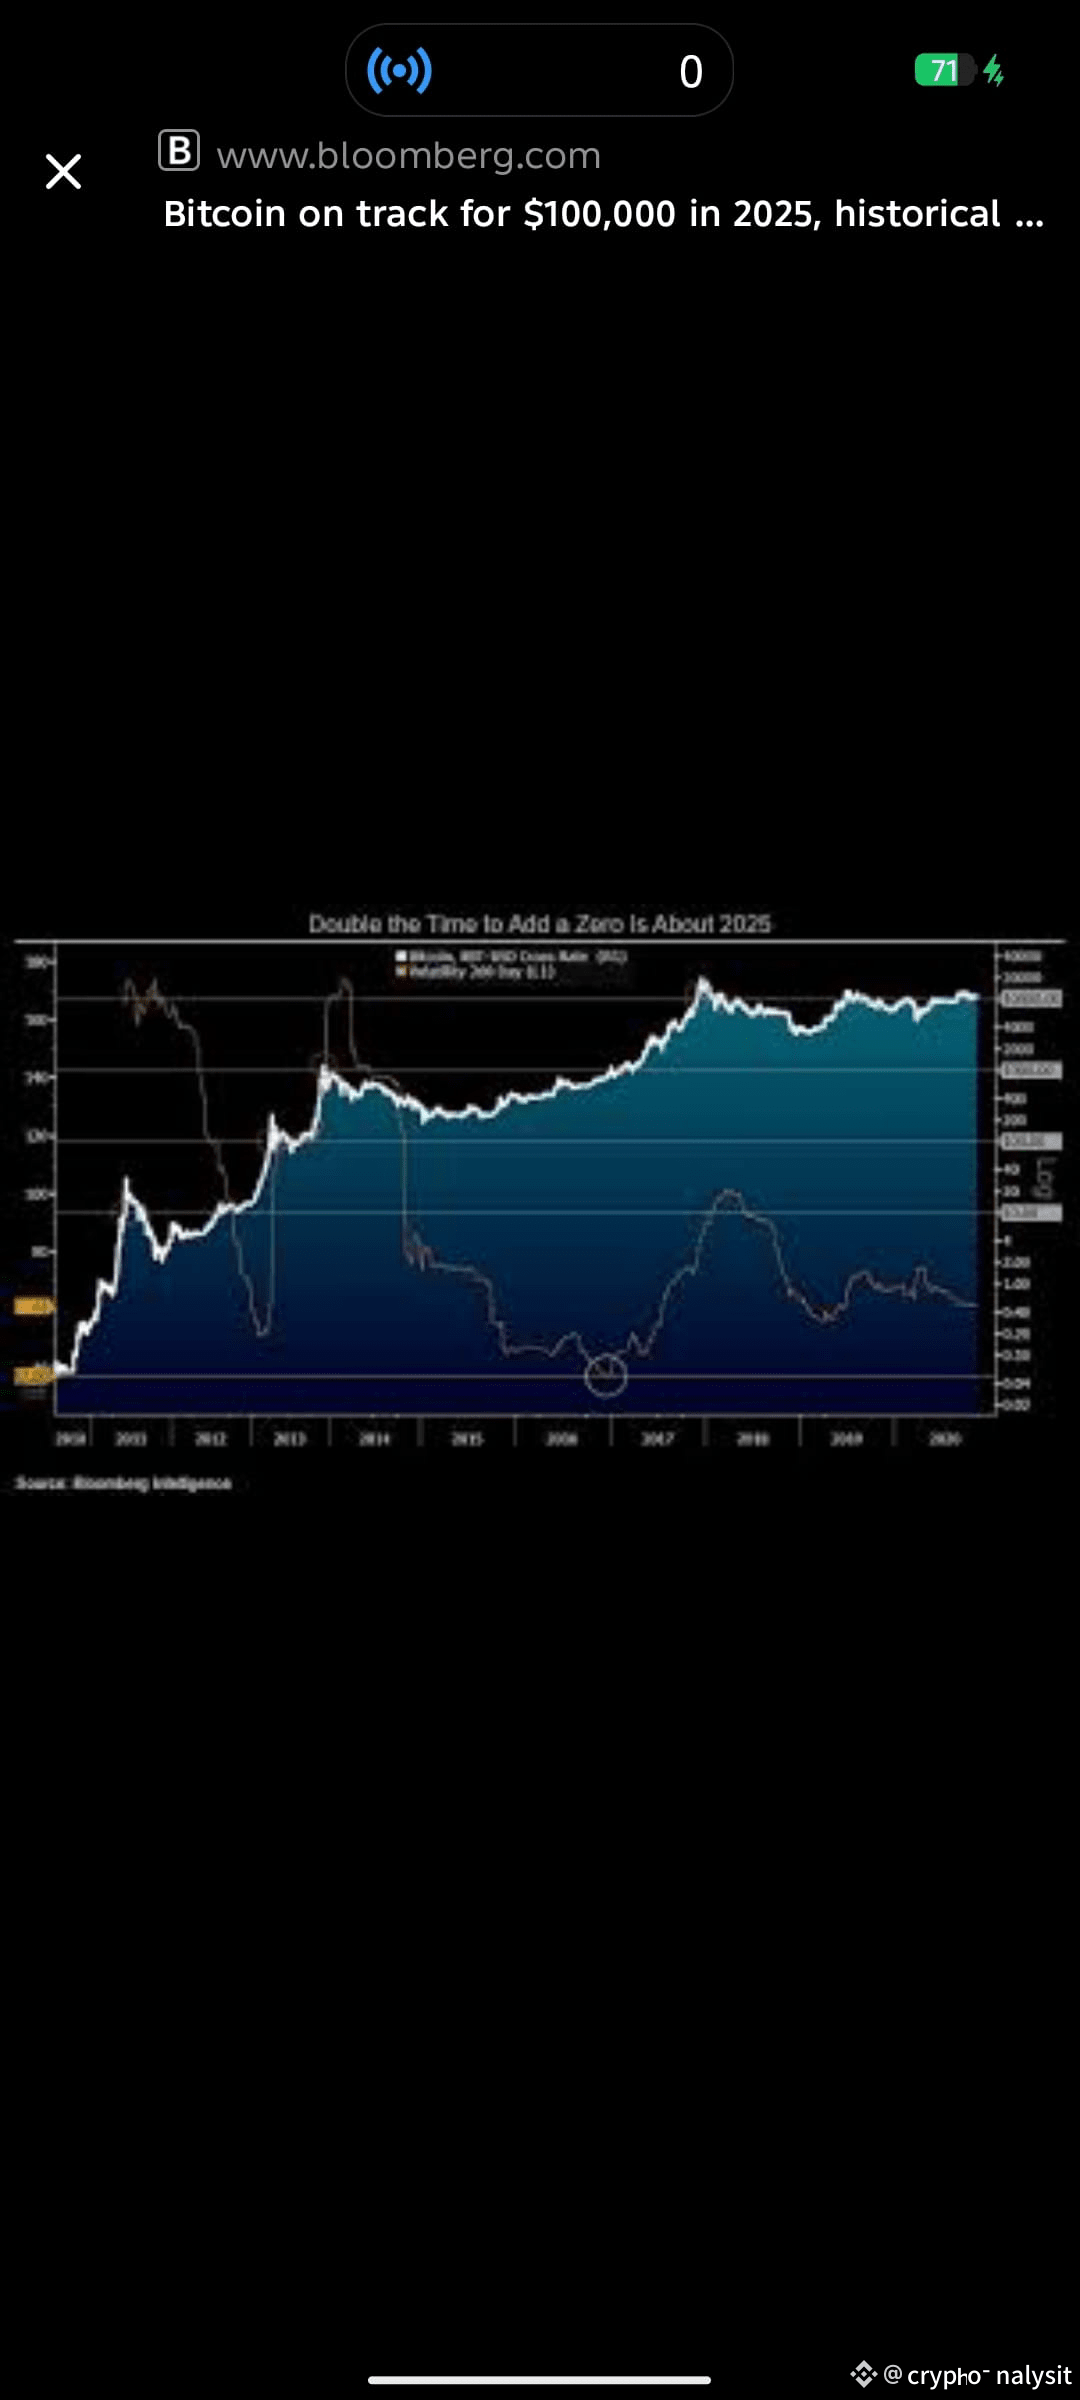
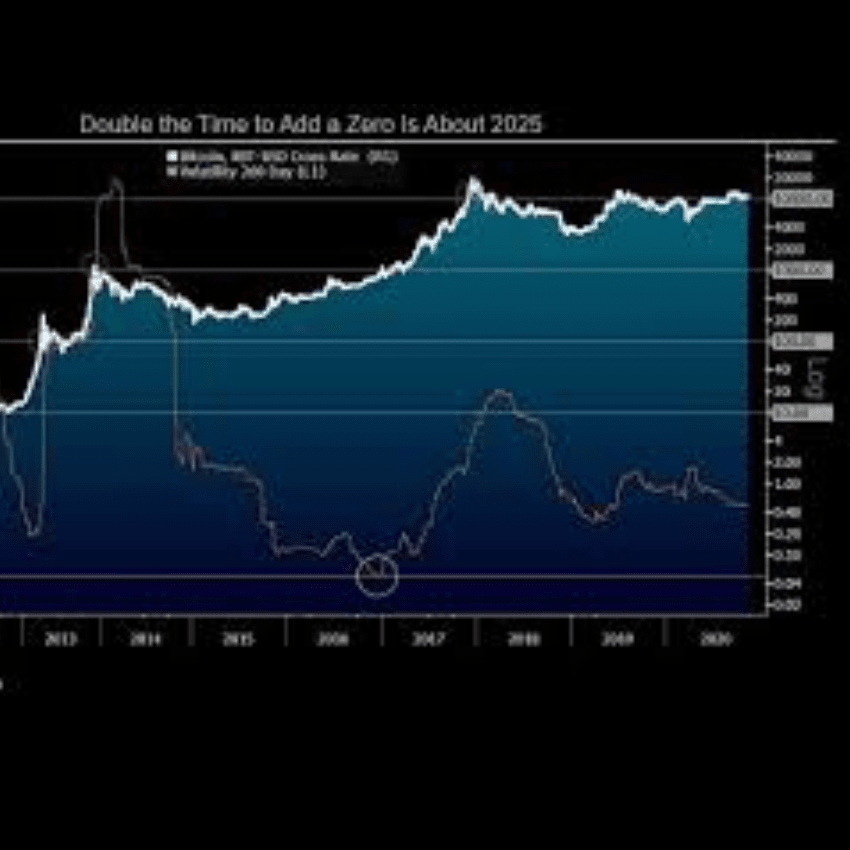
Bitcoin is trading around ~$91,300 USD according to several live sources.
It has fallen from highs in recent months and is showing signs of increased volatility.
Technical indicators show weak momentum: for example, the 14-day RSI is around 43–46, signaling more “sell” than “buy” in the short term.
📉 Key Bearish Signals
The market structure is deteriorating: BTC has broken below key support zones (e.g., ~$93,000) and is sliding.
A “death cross” (50-day moving average crossing below 200-day) is either forming or triggers are being discussed, which historically signals extended bearish pressure.
Institutional sentiment is weakening: major outflows from Bitcoin-based ETFs and broader crypto market weakness.
🟢 Key Support & Resistance Levels
Support: Around $90,000 USD is cited as a major macro support region. If that breaks, risk of further drop increases.
Resistance: ~$93,000–$94,000 USD region is now acting as resistance; earlier attempts to rebound were capped there.
If Bitcoin can stay above the support zone and reclaim resistance, a bounce might be possible. But the bears are currently dominating.
🔭 What to Watch
Break of key support under ~$90K: If that fails, the next leg down could accelerate.
Recovery above ~$94K–95K with strong volume would signal some strength returning.
On-chain signals: large‐holder (“whale”) wallets have increased recently, which could hint at accumulation or at least watchers on the sidelines.
Macro/regulatory: Changes in interest rate expectations, regulatory news, or major institutional actions (ETF flows, etc) could trigger big moves.
Volatility: Expect wide swings — daily ranges appear quite large at current levels.
If you like, I can pull up recent on‐chain metrics, Bitcoin’s correlation with macro stocks/interest rates, and a projected range for next 1–2 weeks. Would you like that?
$BTC
$ETH
$BNB
Bitcoin is trading around ~$91,300 USD according to several live sources.
It has fallen from highs in recent months and is showing signs of increased volatility.
Technical indicators show weak momentum: for example, the 14-day RSI is around 43–46, signaling more “sell” than “buy” in the short term.
📉 Key Bearish Signals
The market structure is deteriorating: BTC has broken below key support zones (e.g., ~$93,000) and is sliding.
A “death cross” (50-day moving average crossing below 200-day) is either forming or triggers are being discussed, which historically signals extended bearish pressure.
Institutional sentiment is weakening: major outflows from Bitcoin-based ETFs and broader crypto market weakness.
🟢 Key Support & Resistance Levels
Support: Around $90,000 USD is cited as a major macro support region. If that breaks, risk of further drop increases.
Resistance: ~$93,000–$94,000 USD region is now acting as resistance; earlier attempts to rebound were capped there.
If Bitcoin can stay above the support zone and reclaim resistance, a bounce might be possible. But the bears are currently dominating.
🔭 What to Watch
Break of key support under ~$90K: If that fails, the next leg down could accelerate.
Recovery above ~$94K–95K with strong volume would signal some strength returning.
On-chain signals: large‐holder (“whale”) wallets have increased recently, which could hint at accumulation or at least watchers on the sidelines.
Macro/regulatory: Changes in interest rate expectations, regulatory news, or major institutional actions (ETF flows, etc) could trigger big moves.
Volatility: Expect wide swings — daily ranges appear quite large at current levels.
If you like, I can pull up recent on‐chain metrics, Bitcoin’s correlation with macro stocks/interest rates, and a projected range for next 1–2 weeks. Would you like that?
$BTC
$ETH
$BNB