

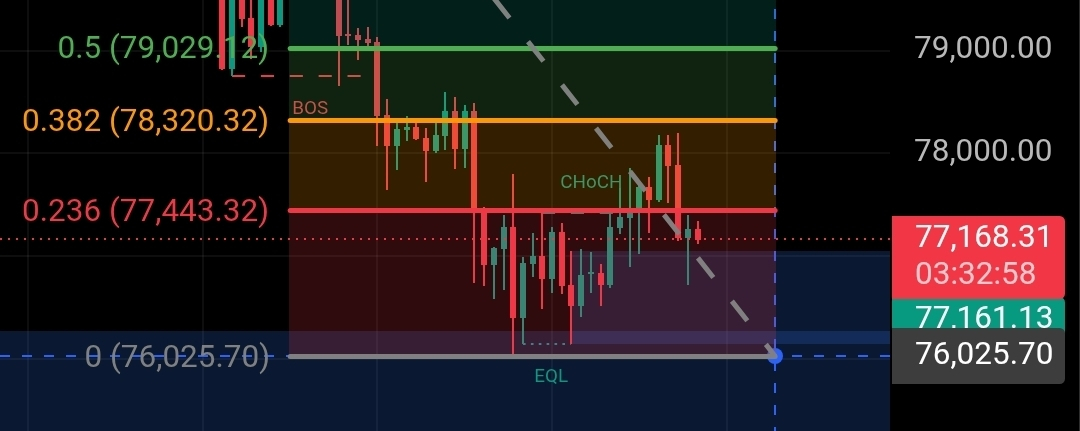

Current Bitcoin price $BTC is at $77,312.90 on the 45-minute chart, showing a fierce battle between buyers and sellers, with the price trapped in a tight range between strong support at $76,700 and stubborn resistance near $78,300. This accumulation hints at an imminent sharp move—but the final direction hinges on a breakout from one of these levels.
Caught between a rock and a hard place
Current scenario: Bitcoin $BTC has been in a tight range since 15/05/2026, moving between $76,700 and $78,150 on the 45-minute chart.
Key support: the $76,700-$76,900 zone is backed by SuperTrend and price movements confirming active buyers.
Strong resistance: the $78,000-$78,300 zone gathers several technical indicators: 200-hour average, SuperTrend resistance, and Fibonacci level 38.2%.
Neutral zone: no trading between $77,100 and $77,800 (a volatile zone with no clear opportunity).
Why are these levels important?
SuperTrend and moving averages: support at $76,700 and price turning above the 20 and 50 averages signaling an attempt to change the short-term trend.
200 average: the price is below it, indicating that the overall trend structure remains bearish on this timeframe.
MACD: bearish momentum is still dominant, supporting the bearish scenario.
Trading volume: is declining during the consolidation, indicating a strong price volatility explosion is close upon breaking the range.
Risk management
Stop loss: above resistance or below support depending on the chosen direction to avoid quick reversals.
Trade management: upon hitting the first target, move the stop to the entry point, and if the second target is hit, trail profits using ATR multiplier.
The most important lesson: entering the market within tight ranges often leads to repeated losses—the best opportunities come after a clear breakout with strong trading volume.
Educational tips
Tight ranges: mean the market is 'storing' energy that will explode in one direction, and patience is often rewarded while waiting for the breakout.
Role of moving averages: breaching the 200 average on the 45-minute chart usually shifts the overall sentiment (from bearish to bullish or vice versa).
Breakout confirmation: look for an increase in volume or MACD crossover to support the new trend after the breakout.