Today's concept learning: What is a descending triangle convergence pattern?
Converging triangles are a typical feature in a downtrend
Price action: highs are sequentially lower, lows are sequentially higher, with narrowing volatility, forming a converging triangle.
Volume changes: during the formation of the pattern, volume gradually shrinks, reflecting strong market indecision.
Statistical probability: about 75% chance that the existing downtrend continues, with only a 25% chance of a reversal.
Key points for market judgment
1. Breakout direction determines the trend
If there's a valid breakdown below the lower boundary (closing price confirmed below the lower line), it's usually seen as a signal for trend continuation, considered a sell or watch opportunity.
If there’s an upward breakout without significant volume, it could be a false breakout, so we need to be cautious.
2. Volume Confirmation of Validity
A downward breakout can be valid without increased volume, but if it’s accompanied by volume, its reliability is higher.
An upward breakout must be confirmed with significant volume increase.
3. Target Price Calculation Method
The minimum drop is calculated as the vertical height at the widest part of the pattern. We project this distance downward from the breakout point to set our target price.
4. Retracement and Failure Signals
After a breakout, there may be a brief retracement:
If a retracement after a downward breakout is blocked by the lower trendline (turning into resistance), the pattern is considered valid.
If there’s a retracement that breaks the upper trendline, the pattern might fail.
Back to live trading
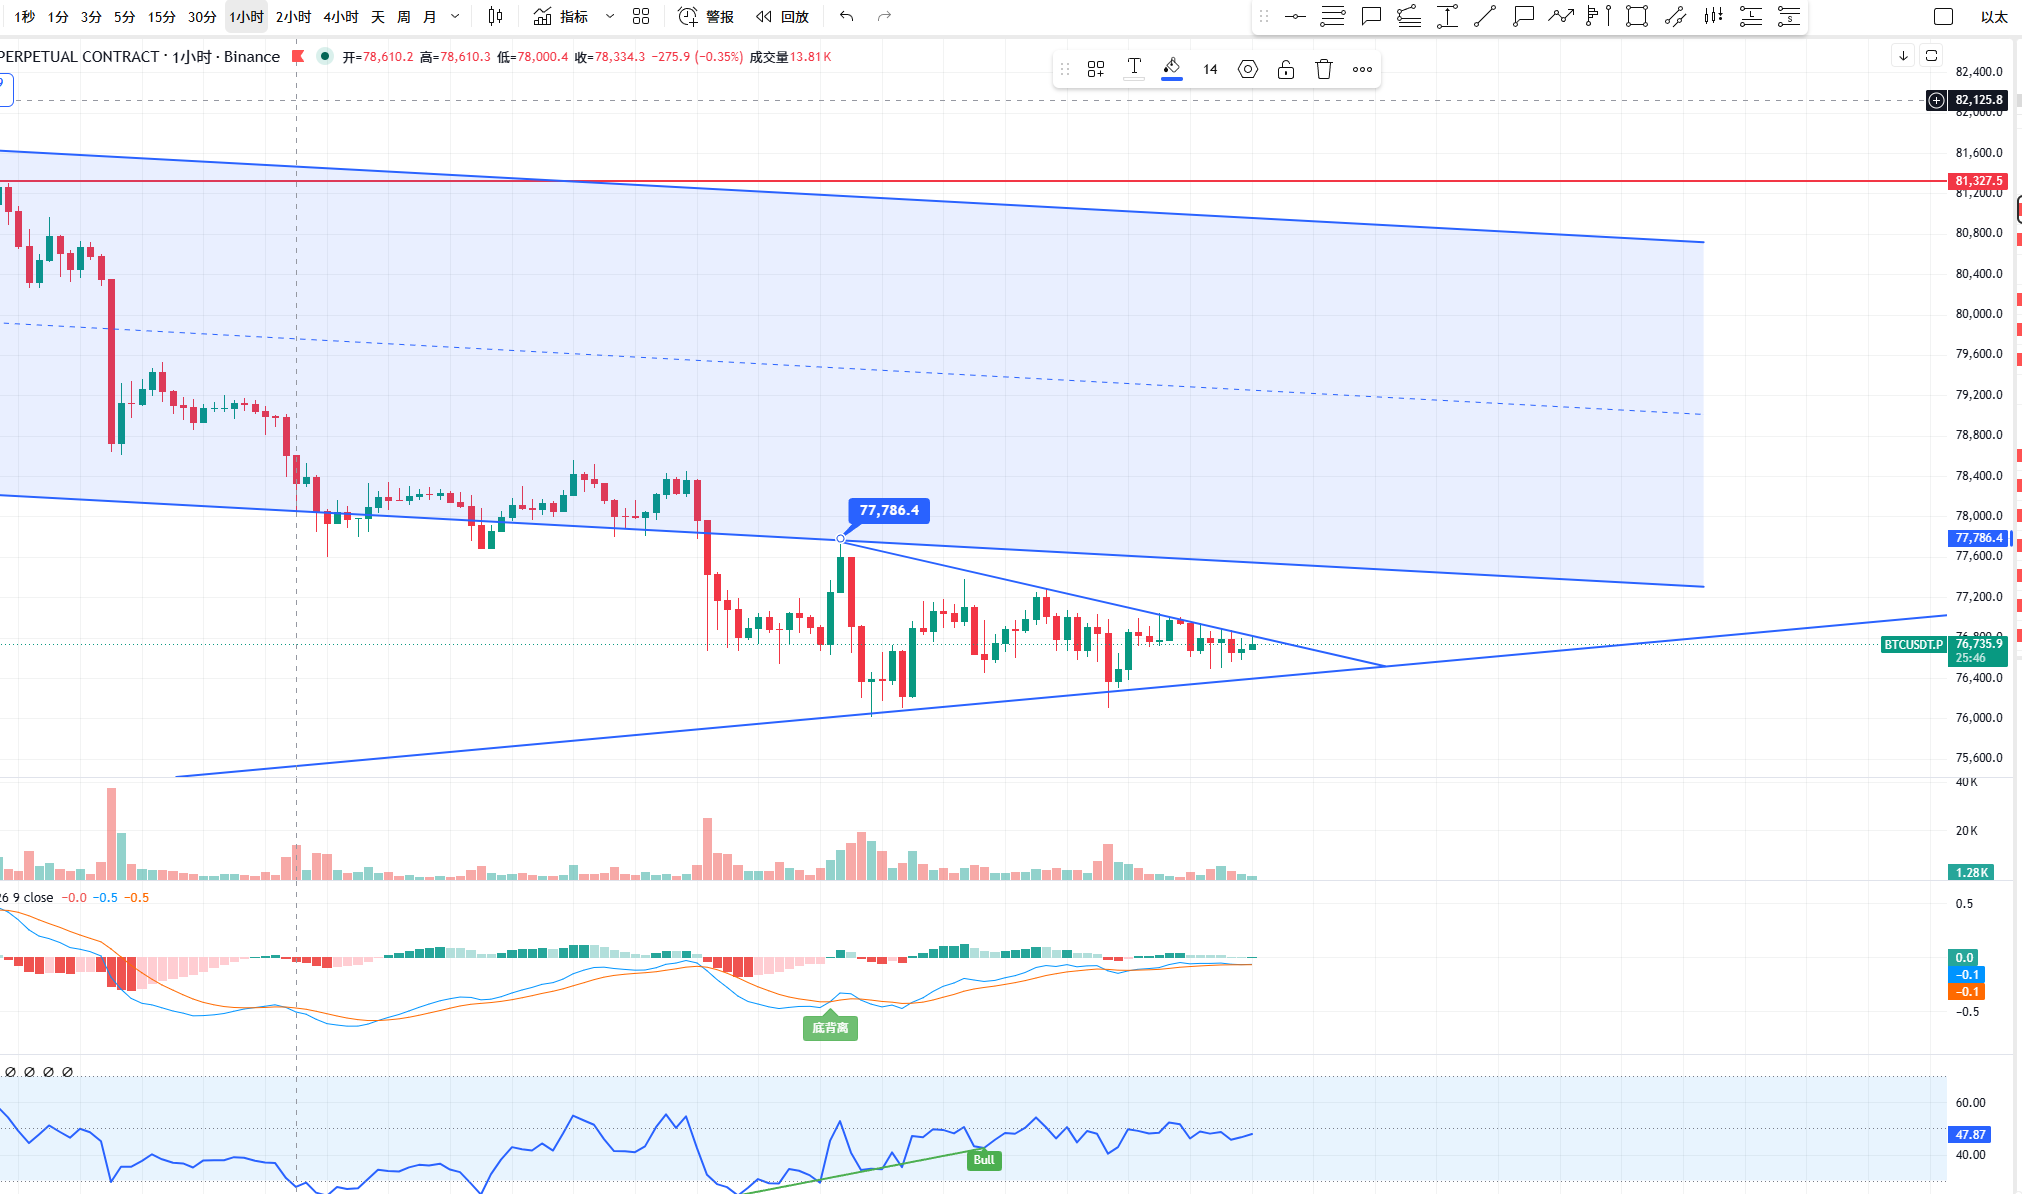
$BTC As shown in Chart 1, Bitcoin entered a descending triangle convergence pattern after breaking below 77800, marking a clear downtrend on the hourly chart. Therefore, we should switch to the 15-minute timeframe to assess the upper and lower trendlines of the triangle. It’s advisable to stay in cash and observe. If we see a volume breakout, it indicates that the short-term decline might be over, leading to a rebound. The overall trend still suggests a bearish pattern.
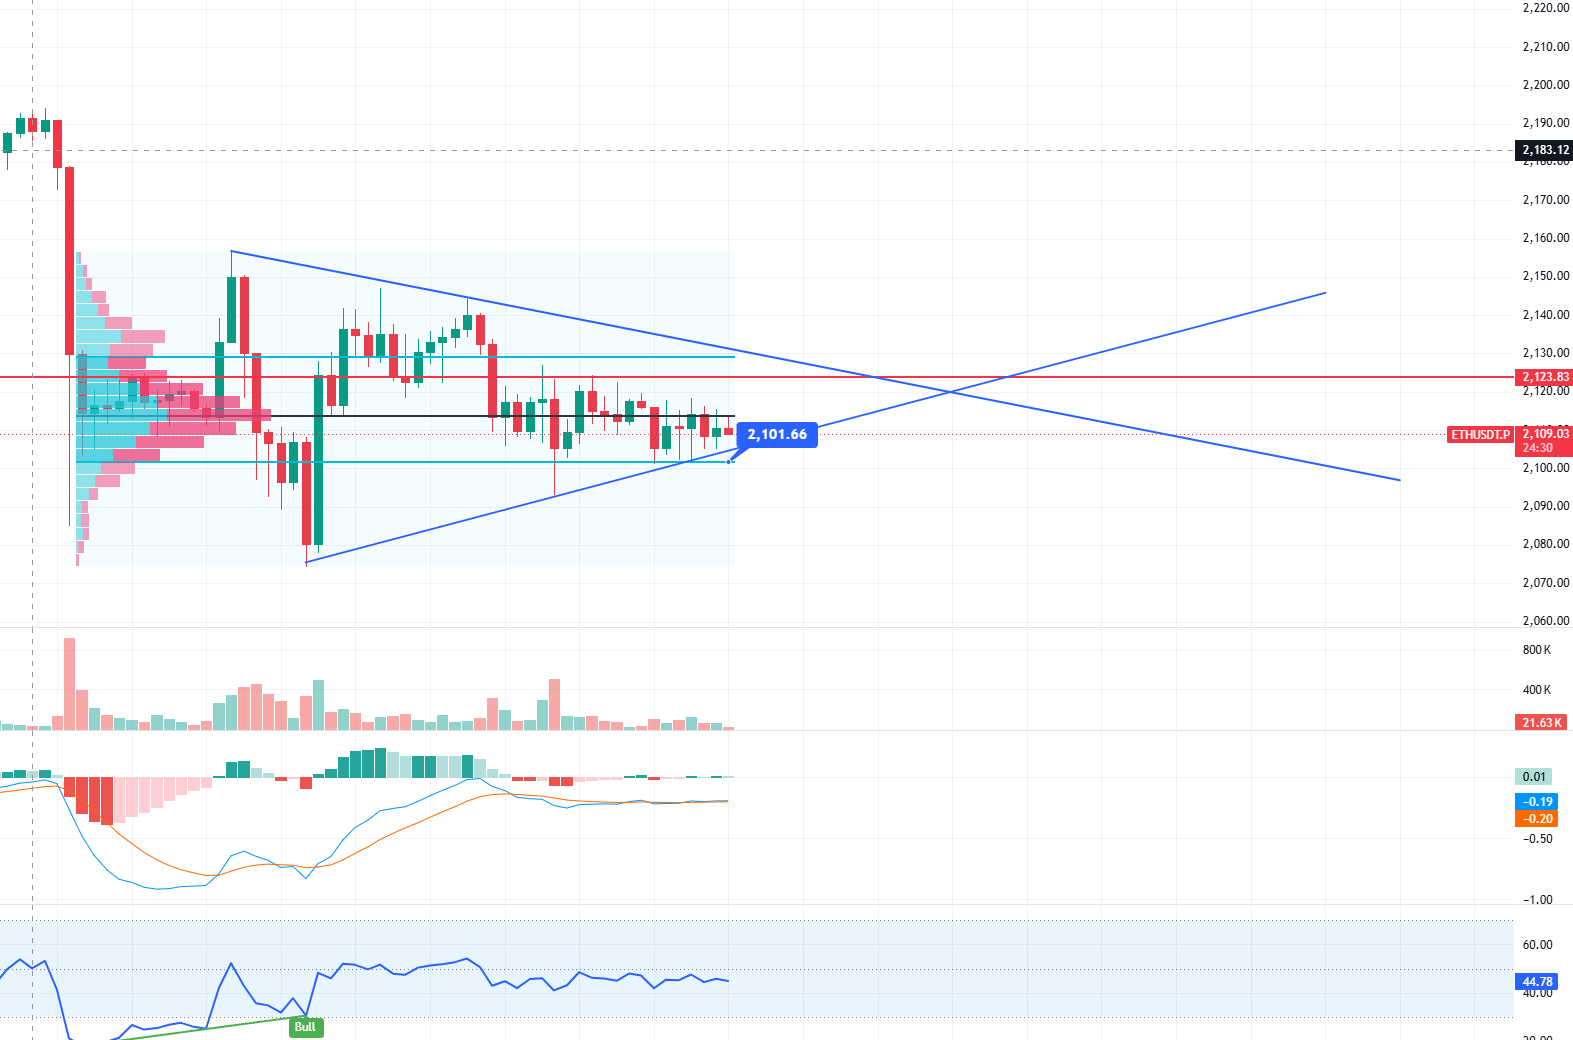
$ETH As shown in Chart 2, Ethereum follows the same logic as Bitcoin, but it doesn’t have the same structural standards as Bitcoin. Overall, the bearish sentiment remains intact. Based on the fixed volume distribution chart, we can identify a minor support around 2100, which has been tested repeatedly over time.