1. Macroeconomic Analysis
1、#DXY

Daily chart
Daily order flow is downward.
This leaves us waiting for the previous low of 103.410 to break and a bearish QM structure to take shape.
The lower target is still 102.6 EQL first, and then the retest of 101.5.

Hourly chart
The hourly order flow is upward, but it is currently in a downward structure.
The trend here is to continue downward, waiting for a break of the previous low of 103.410 to confirm the establishment of a daily bearish QM structure.
In the morning, the market opened with a small level of EQH, and then made a gap-covering move. Currently, the order flow is still downward.
As long as the rebound here does not break 104.207, there will be no problem.
2、#SPX

Daily chart
The daily order flow is downward, but a volatile upward structure is currently running.
The U.S. stock market has retreated normally. We will wait for the opening tonight and pay attention to the retreat of range-EQ and range-L, and then continue to look bullish.
As long as the previous low is not broken here, it is bullish.
Wait for a breakout and solidify of BK, then look at a test of the 4080 BSL above.
3、#ES1!

Hourly chart
Hourly order flow upward.
The test of H1 bearish OB here is rejected, so we will look downward to test H1 OB.
Currently, only the FVG liquidity is consumed here. If it continues to move upward, then we will continue to look at the test of H1 OB. If it breaks through and stabilizes at 4020, the next target will be 4082.
3. Cryptocurrency Market Analysis
1#BTC

Daily chart
Daily order flow is upward.
BTC has broken through the large bottom range and entered the upper range.
As long as the 1D bullish OB around 25,000 is not broken here, we will continue to be bullish.
Upper target W1 bearish OB.

H1 Chart
In terms of hourly order flow, the upward trend is currently continuing.
Currently, the MTF range-H has been broken through to form a deviation zone.
Let's look at the test of EQL first. If it doesn't break, the hourly order flow is still upward, so let's focus on RANGE.
- Long opportunity near eq.
If it falls below EQL, it will probably go down to range-L, and then fall back to HTF range-EQ. Pay attention to the long opportunities around 26100.

F15 Chart
The order flow is downward, and the current structure is a falling structure.
In fact, the top is also a range.
Range-L has been hunted here.
Let’s first look at the interior of the range. If it rebounds here, we’ll first look at the test of EQ. However, if the downward structure continues, look at the position given by H1.
If it breaks through, it will continue to reach new highs.
2、#ETH
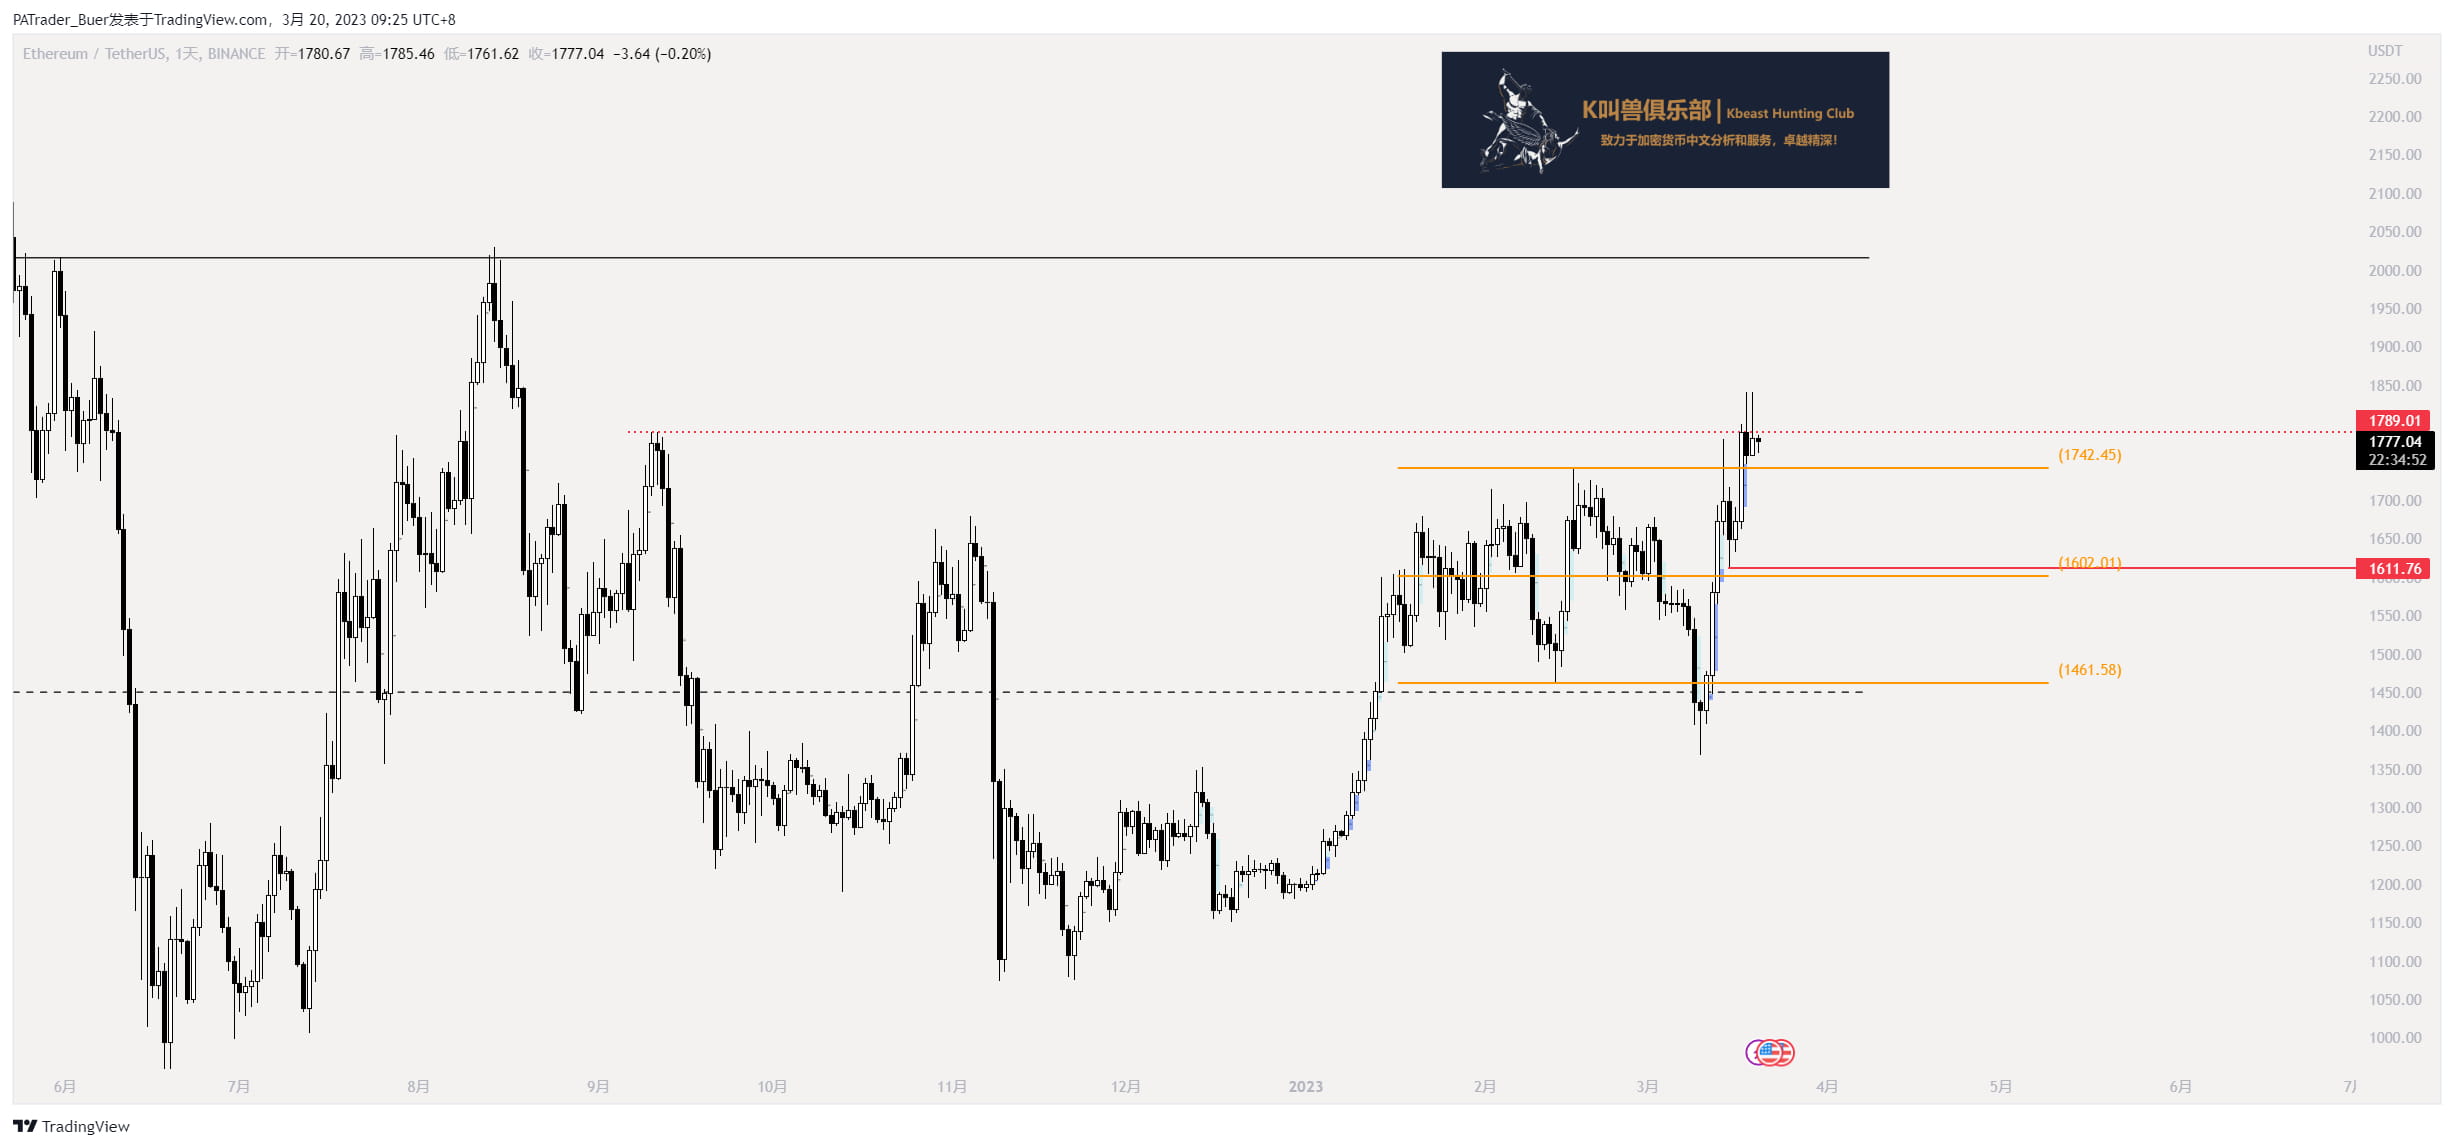
Daily chart
Daily order flow is upward.
ETH builds an MTF-range around 1461-1742, builds a deviation zone downward, and then breaks through range-H upward.
Here it is still, range-H, stand firm and continue to look up to HTF range-H 2000.
If it falls below 1742 and enters the range-, then it will depend on the test of the range-EQ position.

Hourly chart
Hourly order flow upward.
Here is a range within a range.
Here it oscillates in the LTF range 1746-1841 over the weekend, building EQL downward and then building EQH upward.
Here we continue to return to BK and build another EQL. At present, it is still in a falling mechanism, and the small-level structural destruction needs to break through 1785.
If it breaks and falls back but does not break EQL, you can go long and continue to look for new highs.
If 1785 cannot be broken, then continue to move downward and look at the acquisition of EQL and range-L liquidity.
The target will depend on the test of MTF - EQ 1703, and we will observe the long opportunities here.
3、ETH/BTC

Daily chart
The daily order flow is downward and continues to move downward. Here it falls below the previous low. First look at 0.0628 and then look at the BK test below.
Wait for ETH to strengthen and the exchange rate to rebound.
Related PA Transaction Terms
EQH = Equal High
EQL = Equal Low
FVG - Fair Value Gap
HL - Higher Low
HH - Higher High
LL - Lower Low
LH - Lower High
HTF - High Time Frame
LTF - Low Time Frame
MS - Market Structure
OB - Order Block
IDM-Induction Point
MSB, BOS, COS, CH structure destruction