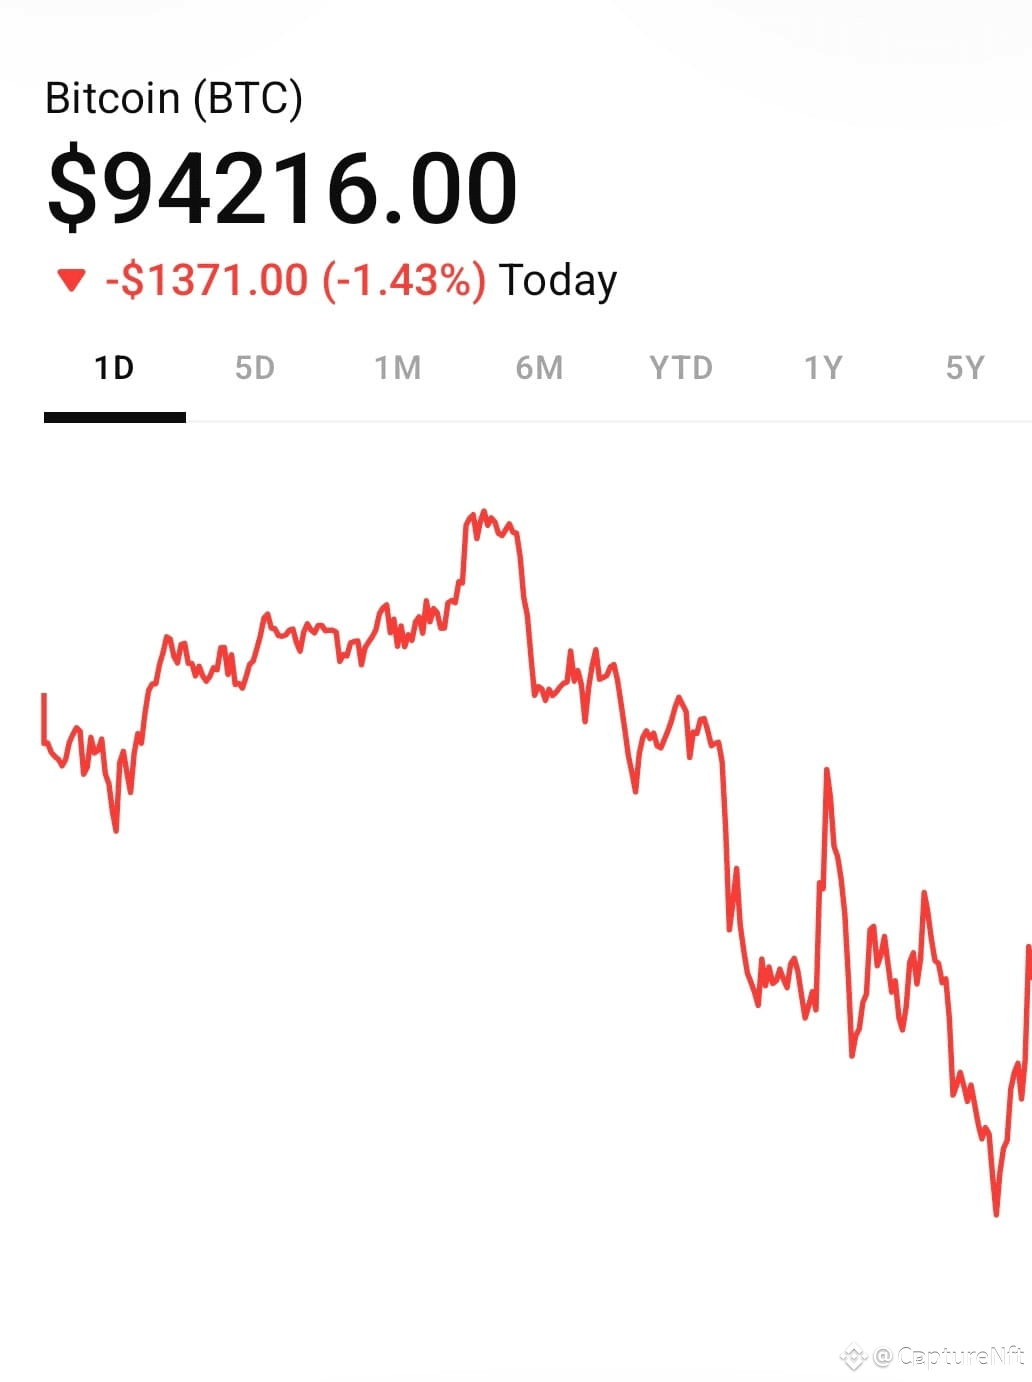
$BTC Current signals
One analysis points out three useful metrics for Bitcoin’s movement: global liquidity (e.g., M2 money supply), stablecoin supply (capital ready to enter crypto), and the price of gold. They note that stablecoin supply is rising strongly which historically precedes price increases, while gold’s delayed correlation suggests a period of sideways action first.
Technical indicators show mixed to bearish signals: On the weekly timeframe, moving averages show bullish bias, but on daily/4-hour charts they appear weaker.
Some forecasts say Bitcoin could continue consolidating in the short term (e.g., trading in a range) unless key supports break.
Other commentary suggests a possible large downside risk: For example one analysis claims a potential bear market could start with Bitcoin dropping toward ~$50,000 if certain cycle theories hold.
🫴What could happen next
Based on the signals above, here are plausible scenarios:
$BTC Bullish scenario:
If stablecoin supply and institutional flows keep increasing, and Bitcoin breaks above a major resistance zone, it could resume a strong upward move. (Some forecasts suggest targets in the ~$120K-$130K+ range if momentum returns.)
Holding key supports and maintaining bullish momentum could push the next leg up.
Sideways/consolidation scenario:
Bitcoin may trade in a range for a while—especially if macro liquidity is high but risk appetite is not fully unleashed. The “gold correlation” suggests possible sideways movement.
This could mean price oscillating without a clear breakout upward or breakdown downward in the near term.
$BTC Bearish scenario:
If Bitcoin loses critical support and macro environment turns hostile (e.g., liquidity tightening, regulatory shock), a deeper correction is possible—some analyses target ~$50K in an extreme scenario.
Technical signs of weakening (e.g., moving averages crossing unfavourably) might trigger a trickle then a fall.
One analysis points out three useful metrics for Bitcoin’s movement: global liquidity (e.g., M2 money supply), stablecoin supply (capital ready to enter crypto), and the price of gold. They note that stablecoin supply is rising strongly which historically precedes price increases, while gold’s delayed correlation suggests a period of sideways action first.
Technical indicators show mixed to bearish signals: On the weekly timeframe, moving averages show bullish bias, but on daily/4-hour charts they appear weaker.
Some forecasts say Bitcoin could continue consolidating in the short term (e.g., trading in a range) unless key supports break.
Other commentary suggests a possible large downside risk: For example one analysis claims a potential bear market could start with Bitcoin dropping toward ~$50,000 if certain cycle theories hold.
🫴What could happen next
Based on the signals above, here are plausible scenarios:
$BTC Bullish scenario:
If stablecoin supply and institutional flows keep increasing, and Bitcoin breaks above a major resistance zone, it could resume a strong upward move. (Some forecasts suggest targets in the ~$120K-$130K+ range if momentum returns.)
Holding key supports and maintaining bullish momentum could push the next leg up.
Sideways/consolidation scenario:
Bitcoin may trade in a range for a while—especially if macro liquidity is high but risk appetite is not fully unleashed. The “gold correlation” suggests possible sideways movement.
This could mean price oscillating without a clear breakout upward or breakdown downward in the near term.
$BTC Bearish scenario:
If Bitcoin loses critical support and macro environment turns hostile (e.g., liquidity tightening, regulatory shock), a deeper correction is possible—some analyses target ~$50K in an extreme scenario.
Technical signs of weakening (e.g., moving averages crossing unfavourably) might trigger a trickle then a fall.