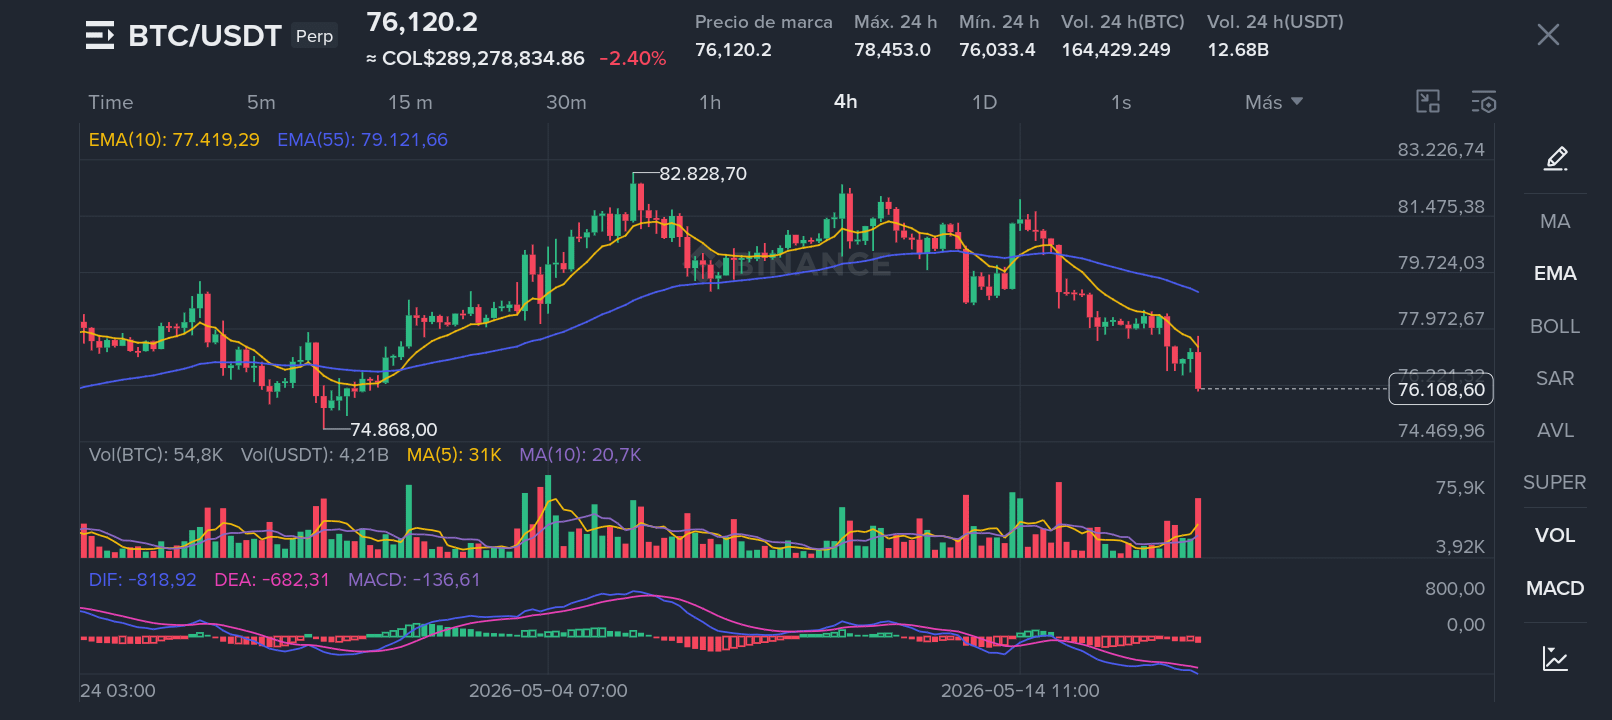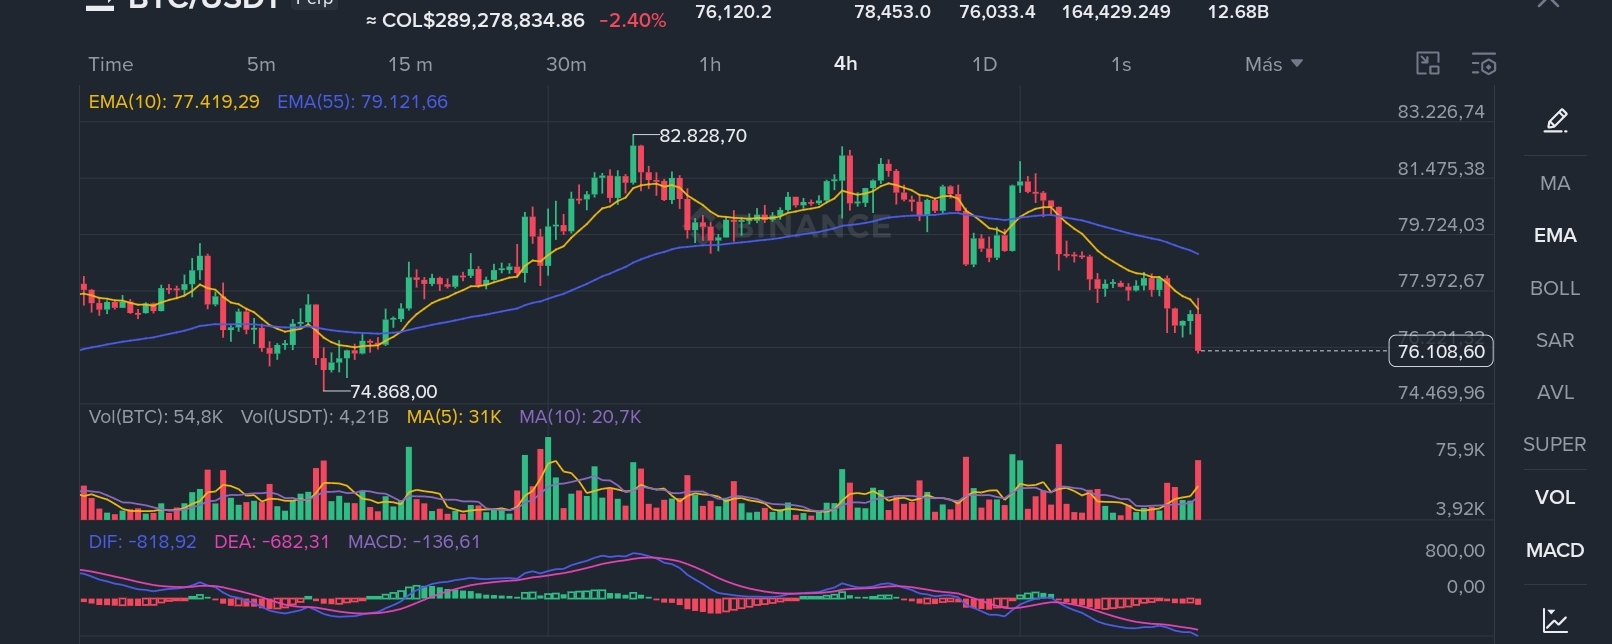

On the 4H timeframe, the structure remains clearly bearish: the price has been making lower highs and lower lows, signaling that the sellers are still in control of the movement.
The EMA 10 is below the EMA 55, and both are sloping downwards, showing that the momentum remains weak. Additionally, the MACD is still below 0, and the histogram remains negative, confirming that the bearish pressure is far from over.
There's also an increase in volume on the red candlesticks, indicating that sell orders are coming in strong, raising the likelihood that the price will continue to seek liquidity in the 74,500 - 74,900 zone, which aligns with the previous low and a potential key support area.
As long as a strong reversal candle with volume and a recovery of the 10 EMA doesn’t appear, the scenario continues to favor bearish continuation or sideways movement before a more solid rebound.
Conclusion
Lower highs + lower lows = active bearish structure.
The EMAs remain slanted downward and the MACD stays negative, while selling volume increases.
If a strong reaction doesn’t show up, Bitcoin could look for the liquidity zone between 74,500 and 74,900 before attempting a bounce.