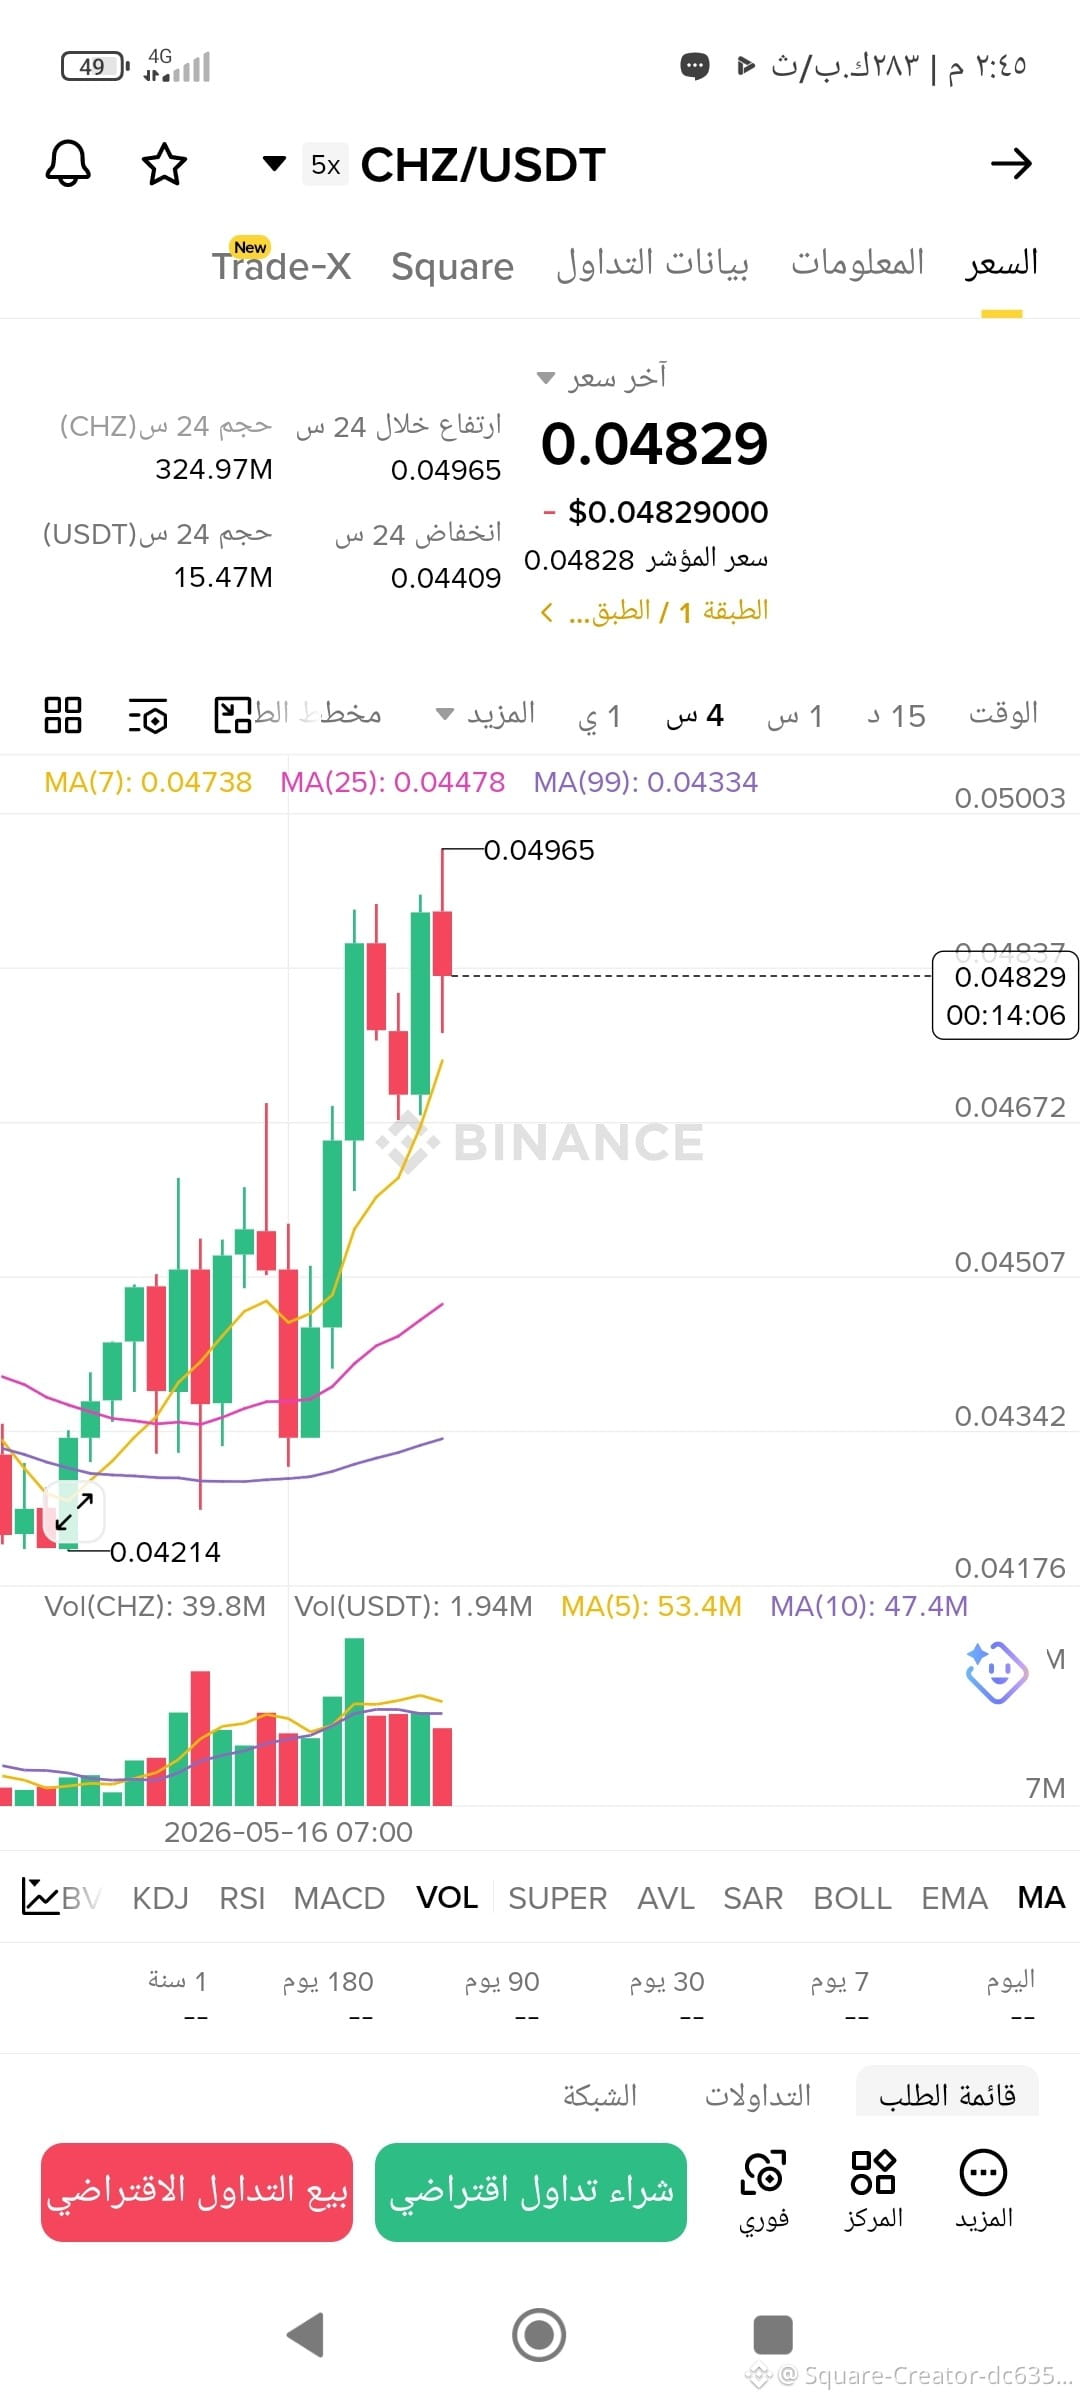
$CHZ Here's a candlestick chart for *CHZ/USDT* on Binance, using 5x leverage, on a 4-hour timeframe.
*What’s shown on the chart:*
1. *Current price*: 0.04829 USDT
2. *Recent movement*: There was a strong surge from 0.04214 to 0.04965, followed by a slight correction down to 0.04829. So, it’s still above the support levels that were broken.
3. *Moving averages*:
- MA(7): 0.04738
- MA(25): 0.04478
- MA(99): 0.04334
The price is above all the moving averages, which indicates a bullish trend in the short to medium term.
4. *Volume*: 24-hour trading volume is 324.97M CHZ, which is high compared to previous days. The rise came with volume, giving it more momentum.$CHZ
5. *Nearby resistance and support levels*:
- Resistance: 0.04965 - the highest peak reached today
- Support: 0.04672 - 0.04738 area around the 7 MA + last low
*In summary:*
The coin is in an uptrend on the 4-hour frame. If it breaks 0.04965, it could continue to 0.0500+. If it drops and breaks 0.0473, it might revisit 0.0467.
This is a technical analysis based on the chart only, not a buy or sell recommendation. With 5x leverage, the risk is amplified, so watch out for your stop loss.
Do you want me to analyze the RSI and MACD indicators below the chart and tell you if there’s any overbought or oversold condition?$CHZ
*What’s shown on the chart:*
1. *Current price*: 0.04829 USDT
2. *Recent movement*: There was a strong surge from 0.04214 to 0.04965, followed by a slight correction down to 0.04829. So, it’s still above the support levels that were broken.
3. *Moving averages*:
- MA(7): 0.04738
- MA(25): 0.04478
- MA(99): 0.04334
The price is above all the moving averages, which indicates a bullish trend in the short to medium term.
4. *Volume*: 24-hour trading volume is 324.97M CHZ, which is high compared to previous days. The rise came with volume, giving it more momentum.$CHZ
5. *Nearby resistance and support levels*:
- Resistance: 0.04965 - the highest peak reached today
- Support: 0.04672 - 0.04738 area around the 7 MA + last low
*In summary:*
The coin is in an uptrend on the 4-hour frame. If it breaks 0.04965, it could continue to 0.0500+. If it drops and breaks 0.0473, it might revisit 0.0467.
This is a technical analysis based on the chart only, not a buy or sell recommendation. With 5x leverage, the risk is amplified, so watch out for your stop loss.
Do you want me to analyze the RSI and MACD indicators below the chart and tell you if there’s any overbought or oversold condition?$CHZ