Bitcoin $BTC — Latest Analysis
🧮 Current Situation
Bitcoin recently fell to around US $95 000–US $100 000, marking a six-month low as broad risk-assets sell-off.
Technical indicators are flashing caution: a potential “death cross” (short-term moving average crossing below long-term) may be forming, signalling weaker momentum.
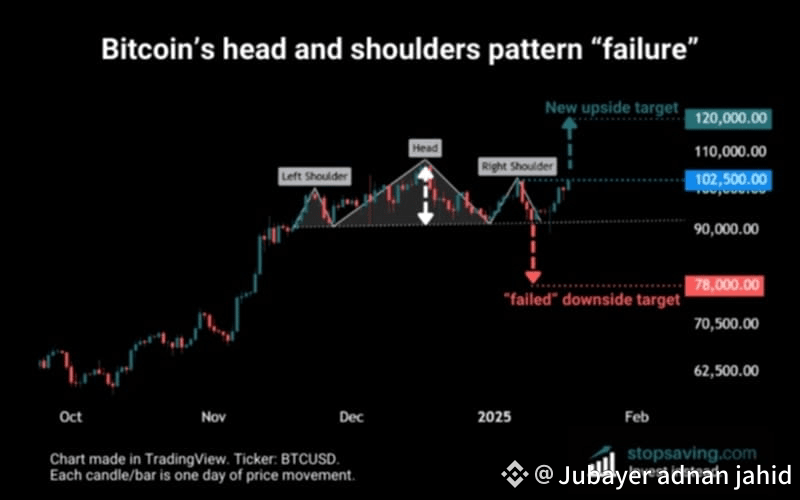
Market structure shows a developing head-and-shoulders pattern (bearish) with increasing outflows from long-term holders.
✅ Key Support & Resistance Levels
Support: near US $100 000 is a crucial level — if that breaks, downside risk climbs.
If support is lost, some analysts project a decline toward US $74 000 (≈30 % drop) in a strong bearish scenario.
On the upside, reclaiming strength above ~US $105 000–US $110 000 could pause the decline and give some breathing space.
🎯 What’s Driving the Move
Macro headwinds: Expectations of a US Federal Reserve rate cut have diminished, which weighs on risk-assets like Bitcoin.
Investor behaviour: Long-term holders are selling in unusually high volumes (~815 000 BTC in 30 days) — typically a sign of weakening conviction.
Technical momentum: With weak buying demand and heavy distribution, bullish momentum is fragile at best.
🔍 My View (not financial advice)
Given the mix of technical weakness + macro risks + holder selling, the path of least resistance appears downward in the near term. However, if Bitcoin holds above ~US $100 000 and macro-risk sentiment improves, a short-term rebound is possible.
Bearish case: Support breaks → drop toward US $75 000–US $80 000
Base case: Finds support around US $100 000–US $105 000 and trades sideways for a period
Bullish case: Macro risk abates, demand comes back, and BTC reclaims US $110 000+ to spark upside momentum
If you’d like, I can pull up a detailed chart of Bitcoin’s key levels for the next 1-3 months (with local timezone converted to Bangladesh) — would you like that?#MarketPullback #PowellRemarks #PowellWatch
🧮 Current Situation
Bitcoin recently fell to around US $95 000–US $100 000, marking a six-month low as broad risk-assets sell-off.
Technical indicators are flashing caution: a potential “death cross” (short-term moving average crossing below long-term) may be forming, signalling weaker momentum.
Market structure shows a developing head-and-shoulders pattern (bearish) with increasing outflows from long-term holders.
✅ Key Support & Resistance Levels
Support: near US $100 000 is a crucial level — if that breaks, downside risk climbs.
If support is lost, some analysts project a decline toward US $74 000 (≈30 % drop) in a strong bearish scenario.
On the upside, reclaiming strength above ~US $105 000–US $110 000 could pause the decline and give some breathing space.
🎯 What’s Driving the Move
Macro headwinds: Expectations of a US Federal Reserve rate cut have diminished, which weighs on risk-assets like Bitcoin.
Investor behaviour: Long-term holders are selling in unusually high volumes (~815 000 BTC in 30 days) — typically a sign of weakening conviction.
Technical momentum: With weak buying demand and heavy distribution, bullish momentum is fragile at best.
🔍 My View (not financial advice)
Given the mix of technical weakness + macro risks + holder selling, the path of least resistance appears downward in the near term. However, if Bitcoin holds above ~US $100 000 and macro-risk sentiment improves, a short-term rebound is possible.
Bearish case: Support breaks → drop toward US $75 000–US $80 000
Base case: Finds support around US $100 000–US $105 000 and trades sideways for a period
Bullish case: Macro risk abates, demand comes back, and BTC reclaims US $110 000+ to spark upside momentum
If you’d like, I can pull up a detailed chart of Bitcoin’s key levels for the next 1-3 months (with local timezone converted to Bangladesh) — would you like that?#MarketPullback #PowellRemarks #PowellWatch