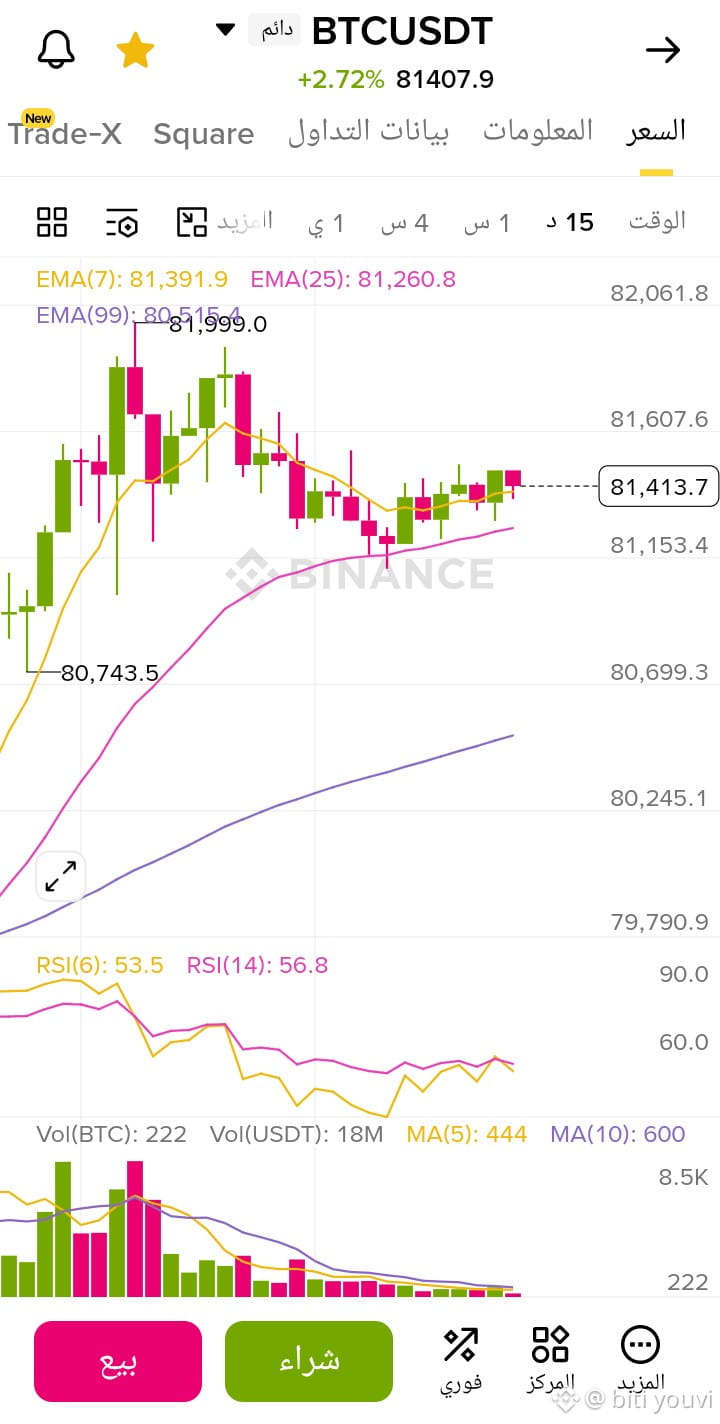
Quick analysis of the BTCUSDT chart on a 15-minute frame:
Current price is close to 81,413.
The short trend is still slightly bullish because:
EMA7 is above EMA25
and the price is above EMA25.
However, the momentum is a bit weak as the candlesticks (velas) have become small and the volume is low.
Visible averages:
EMA7 ≈ 81,391
EMA25 ≈ 81,260
EMA99 ≈ 80,515
This means the overall trend remains positive as long as the price stays above EMA25 and EMA99.
RSI Indicator:
RSI14 is around 56.
There’s no overbought or oversold condition.
The market is in a neutral area leaning towards bullish.
Key levels:
Nearby support: 81,250 then 81,150
Resistance: 81,600 then 82,000
If it breaks 81,600 with strong trading volume, it may continue to rise towards 82k. However, if it breaks 81,250, we might see a short corrective drop.
The current price action looks like:
Accumulation / consolidation after a rise.
The market is waiting for stronger volume to determine the next direction.
To better understand the relationship between moving averages and price:
In spot trading:
Don’t jump in for a buy just because the candlestick is green.
Wait for:
A break above resistance
or a clear bounce from support
with an increase in volume.
Always set a stop loss, especially on a 15-minute frame because it moves fast.$BTC #BitcoinRatioAbove200DMA
Current price is close to 81,413.
The short trend is still slightly bullish because:
EMA7 is above EMA25
and the price is above EMA25.
However, the momentum is a bit weak as the candlesticks (velas) have become small and the volume is low.
Visible averages:
EMA7 ≈ 81,391
EMA25 ≈ 81,260
EMA99 ≈ 80,515
This means the overall trend remains positive as long as the price stays above EMA25 and EMA99.
RSI Indicator:
RSI14 is around 56.
There’s no overbought or oversold condition.
The market is in a neutral area leaning towards bullish.
Key levels:
Nearby support: 81,250 then 81,150
Resistance: 81,600 then 82,000
If it breaks 81,600 with strong trading volume, it may continue to rise towards 82k. However, if it breaks 81,250, we might see a short corrective drop.
The current price action looks like:
Accumulation / consolidation after a rise.
The market is waiting for stronger volume to determine the next direction.
To better understand the relationship between moving averages and price:
In spot trading:
Don’t jump in for a buy just because the candlestick is green.
Wait for:
A break above resistance
or a clear bounce from support
with an increase in volume.
Always set a stop loss, especially on a 15-minute frame because it moves fast.$BTC #BitcoinRatioAbove200DMA