
.
Now the context has changed quite a bit compared to the previous analysis.
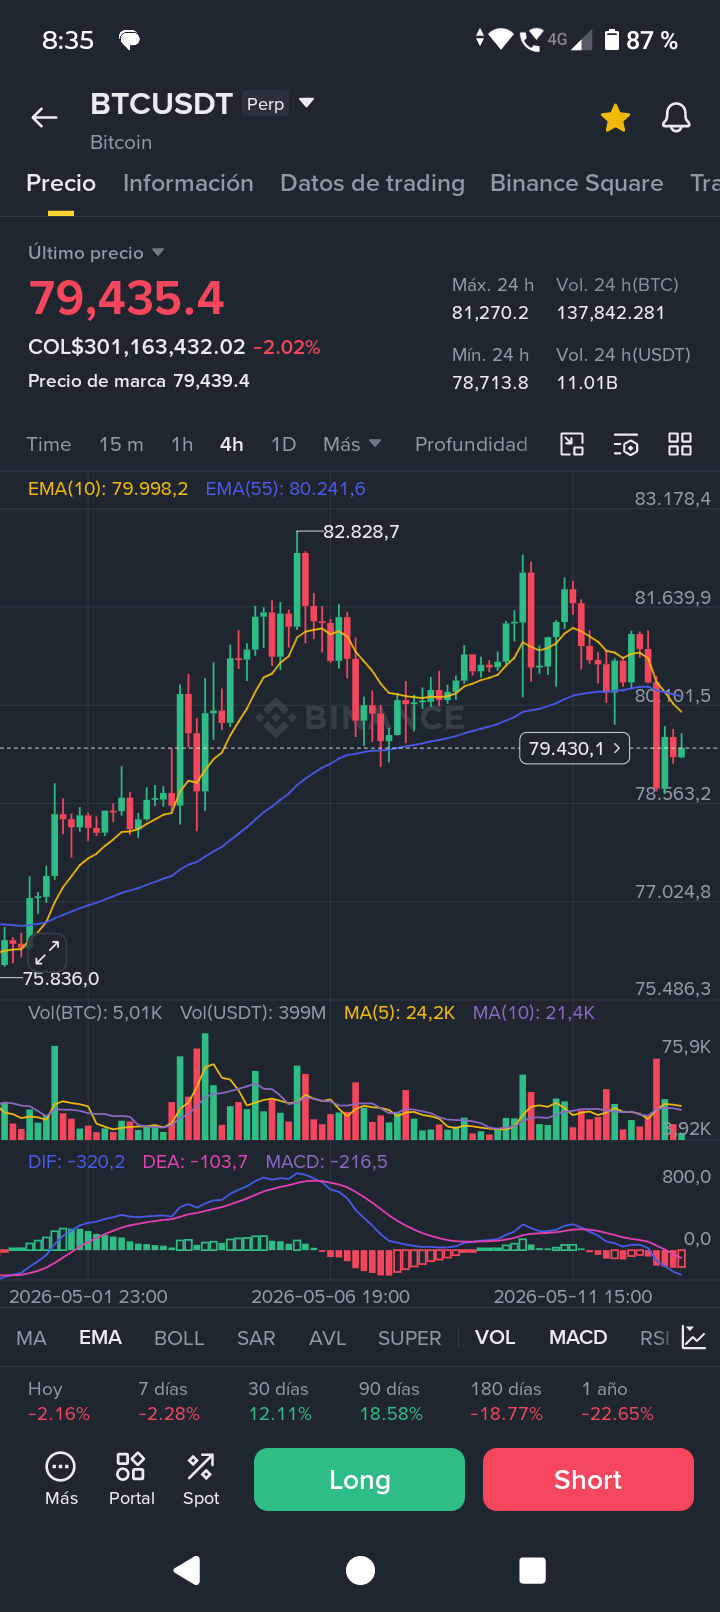
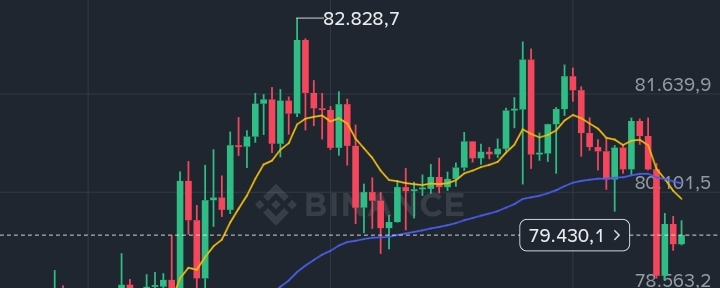
The drop came with volume, loss of the EMAs, and bearish expansion of the MACD, signals that increase the likelihood of continuation towards lower liquidity zones.
As long as the price stays below the moving averages, the market could target the 75K–74K zone before hitting significant support.
The key now will be to watch for any absorption of sell orders or if the bearish momentum continues to accelerate.
The difference this time is that the drop came with strong bearish confirmations:
Clear breakout of the EMA 55.
Price trading below both EMAs.
MACD expanding downward with an increase in negative histogram.
bearish impulsive candle with volume.
And there was also a structure break on the 4H.
This no longer looks like just a simple pullback or healthy consolidation.
Now the market is showing intent to seek deeper liquidity.
The next logical zone visible on the chart could be around 75K–74K because:
there's the next important previous reaction area,
there's accumulated liquidity,
and psychologically, it would be a zone where strong buyers could re-enter.
We also need to keep an eye on if it appears:
sell absorption,
long lower wicks,
divergences in MACD,
or a decrease in bearish volume.
Because many times after an impulsive drop, the market does:
1. bearish expansion,
2. liquidity sweep,
3. strong relief bounce.