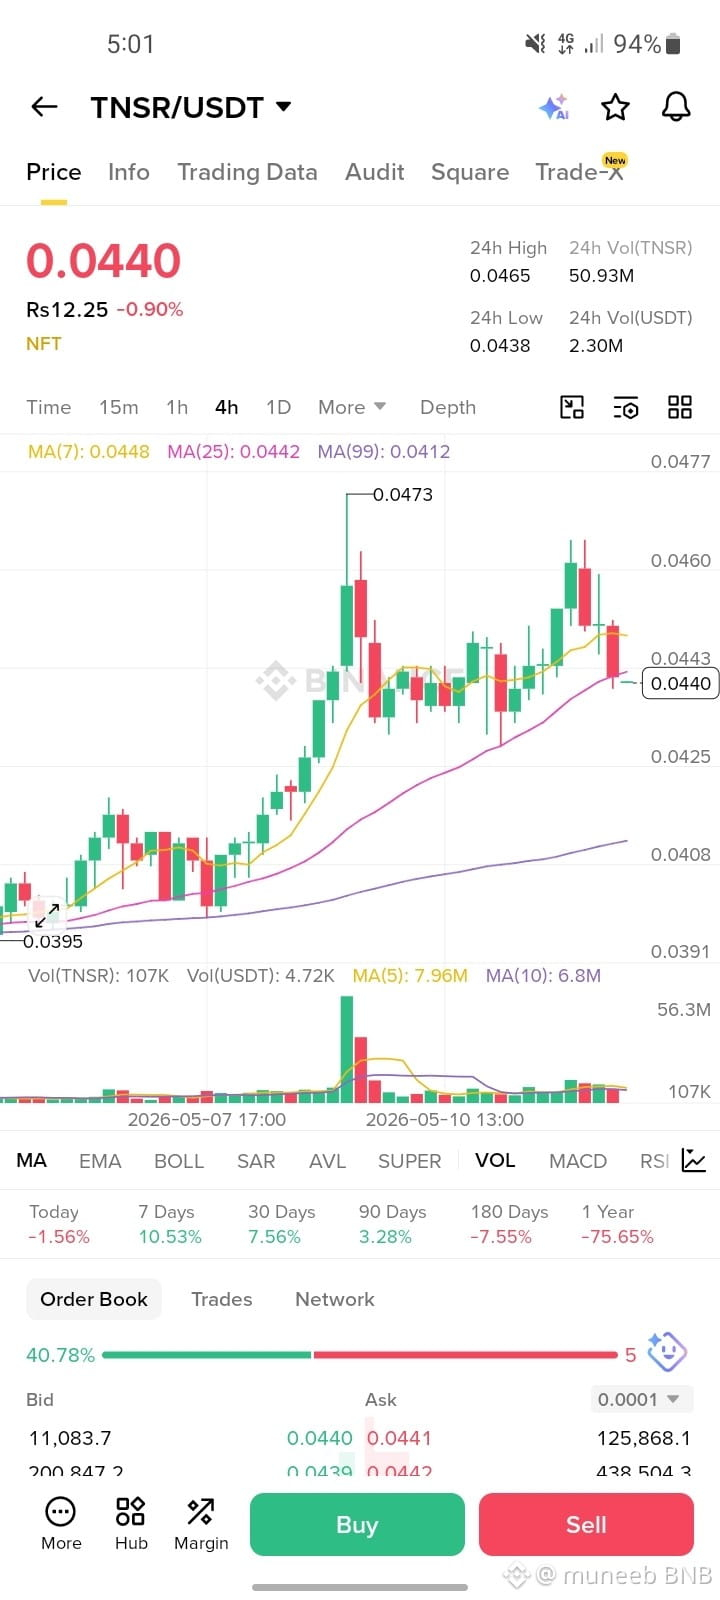
here is the short-term analysis for TNSR/USDT as of May 12, 2026:
### Current Market Context
Price Action: TNSR is trading at $0.0440, showing a slight daily decline of -0.90%.
Trend: The 4-hour chart shows a recent consolidation phase following a local peak near $0.0473. The price is currently resting near the MA(25) at $0.0442, which is acting as immediate resistance.
Momentum: Short-term indicators are mixed. While the RSI (14) recently signaled overbought conditions (above 70), it has cooled toward neutral levels.
### Predicted Movements
Bullish Case: A breakout and sustained hold above $0.0445 could trigger a retest of recent highs near $0.0473 to $0.0483.
Bearish Case: If the price fails to hold the current support at $0.0438, it may slide toward the solid support zone between $0.0415 and $0.0395.
$TNSR
#ClarityActDraft #BinanceOnline #FedChairTransitionNears MARAsNetLossWidensto$1.3BillioninQ1#BitcoinOrdinalsBrowserOrd.iotoShutDown #IranRejectsUSPeacePlan
### Current Market Context
Price Action: TNSR is trading at $0.0440, showing a slight daily decline of -0.90%.
Trend: The 4-hour chart shows a recent consolidation phase following a local peak near $0.0473. The price is currently resting near the MA(25) at $0.0442, which is acting as immediate resistance.
Momentum: Short-term indicators are mixed. While the RSI (14) recently signaled overbought conditions (above 70), it has cooled toward neutral levels.
### Predicted Movements
Bullish Case: A breakout and sustained hold above $0.0445 could trigger a retest of recent highs near $0.0473 to $0.0483.
Bearish Case: If the price fails to hold the current support at $0.0438, it may slide toward the solid support zone between $0.0415 and $0.0395.
$TNSR
#ClarityActDraft #BinanceOnline #FedChairTransitionNears MARAsNetLossWidensto$1.3BillioninQ1#BitcoinOrdinalsBrowserOrd.iotoShutDown #IranRejectsUSPeacePlan