#Bitcoin❗ Bitcoin (BTC) Candlestick Chart Analysis
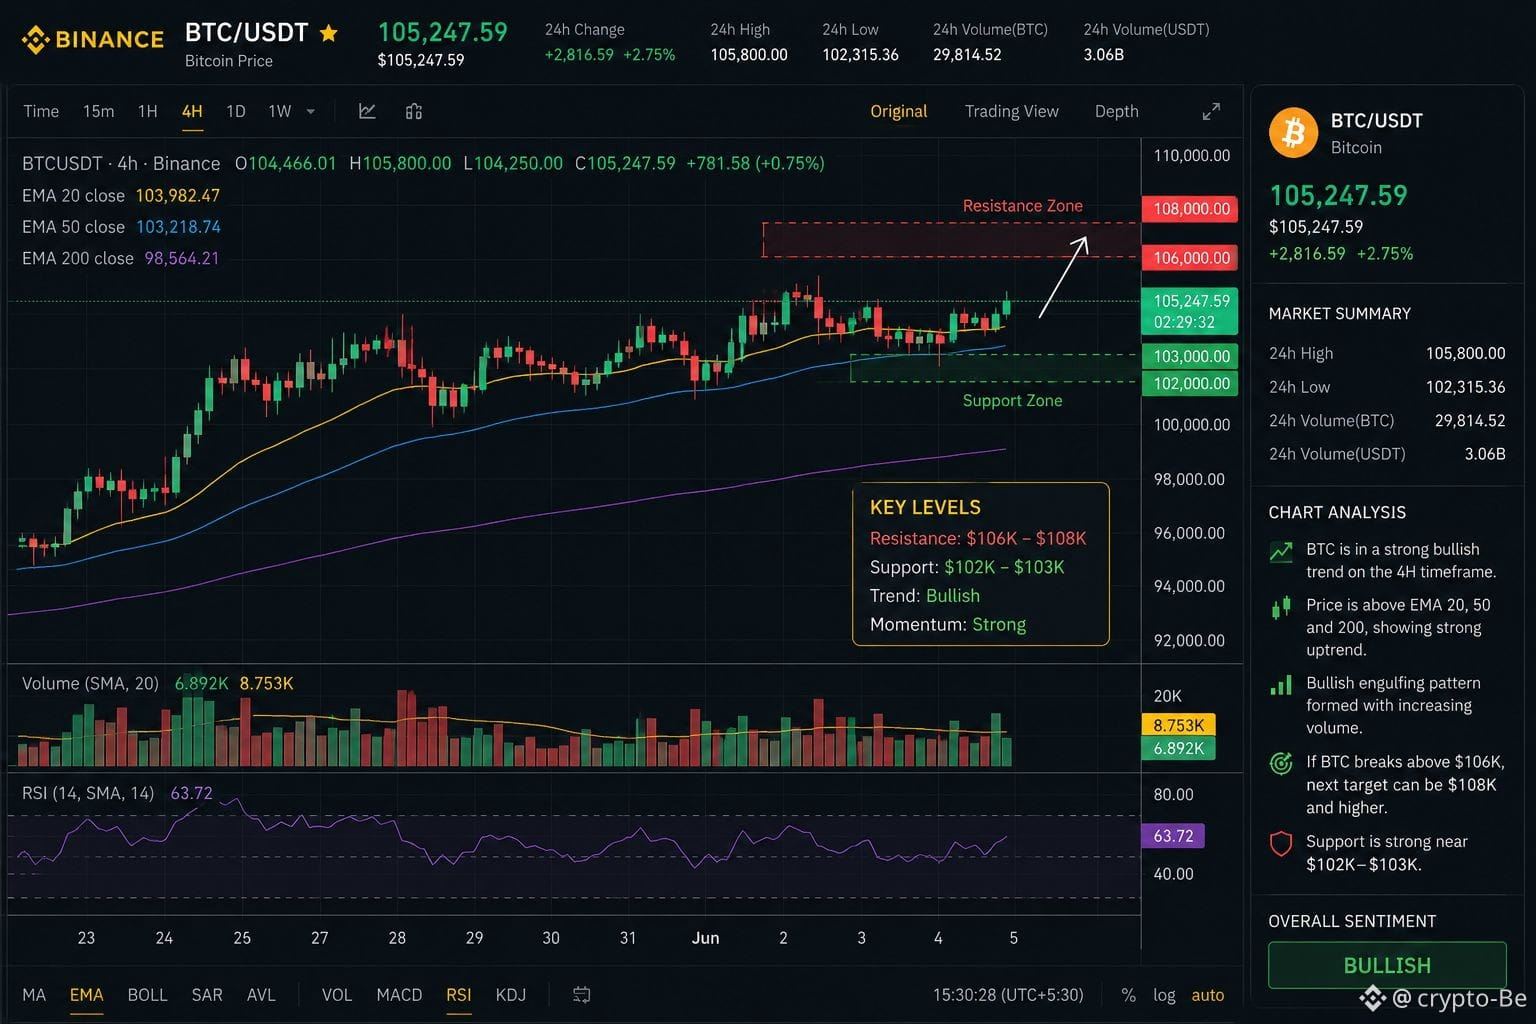
Bitcoin is currently showing a bullish trend on Binance with strong buyer momentum.
📈 Candlestick Analysis (4H Timeframe):
Recent candles formed a bullish engulfing pattern, signaling buyer strength.
BTC is holding above major support near $102K–103K.
Resistance zone appears around $106K–108K.
Volume is increasing during green candles, which supports continuation upward.
If $BTC BTC breaks resistance, the next move could target a fresh local high.
Market Sentiment
Short-term trend: Bullish
Momentum: Strong
Risk level: Medium due to volatility
Bitcoin is currently showing a bullish trend on Binance with strong buyer momentum.
📈 Candlestick Analysis (4H Timeframe):
Recent candles formed a bullish engulfing pattern, signaling buyer strength.
BTC is holding above major support near $102K–103K.
Resistance zone appears around $106K–108K.
Volume is increasing during green candles, which supports continuation upward.
If $BTC BTC breaks resistance, the next move could target a fresh local high.
Market Sentiment
Short-term trend: Bullish
Momentum: Strong
Risk level: Medium due to volatility