
 Yesterday, I analyzed all the macro signals I could find, which relates to the level of 'why the volatility'.
Today, we focus on 'where the turning point is'.
Conclusion first: 106,000 USD is the key decision point.
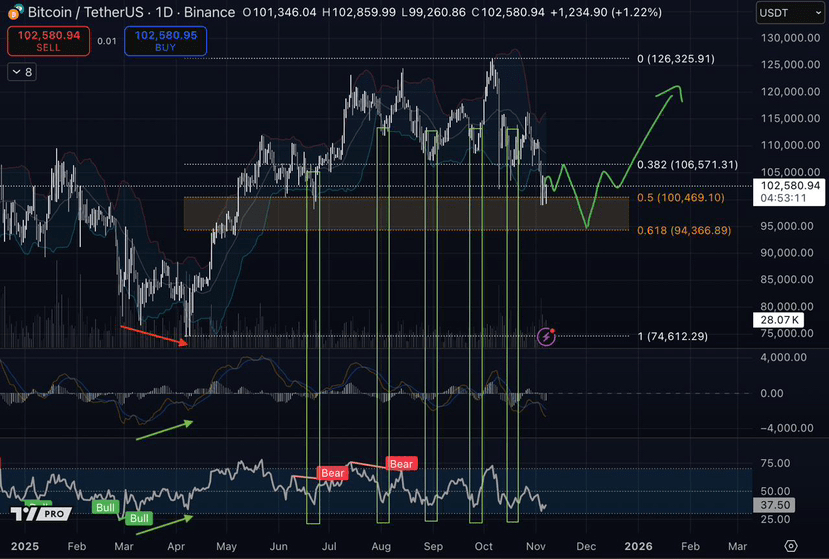
The chart below is my personal analysis of Bitcoin's price trend, combining resonance signals from RSI, MACD, and Fibonacci structures.
Bitcoin is likely to rise towards the 106,000 USD area, after which it faces two possibilities:
· If it encounters resistance and falls back at 106,000, the price may retrace to the range of 94,000 to 98,000 USD (corresponding to Fibonacci 0.5-0.618 retracement levels) before rebounding.
· If it effectively breaks through 106,000, the rally before Christmas may start here, and a deep correction is unlikely before the holiday.
The following is a technical breakdown 👇
1. The current price of Bitcoin is about 10.2 million dollars, testing the lower band of the Bollinger Bands
2. This position often overlaps with phase exhaustion areas during mid-cycle pullbacks
3. RSI is around 37, entering an emotional oversold zone, indicating a decrease in downward momentum
4. Although the MACD histogram maintains negative values, the narrowing red bars suggest momentum exhaustion
When the price touches the lower band of the Bollinger Bands, RSI is below 40, and MACD starts to flatten, it often indicates a short-term rebound or even the formation of a local bottom. The current shape is highly similar to several previous resonance bottoms (the green box areas in the picture).
---
Resonance bottom feature 👇
1. These green box areas have not shown textbook-style top divergence
2. Instead, multiple exhaustion indicators resonate and exert force:
· RSI dips to the midline of 35, marking emotional selling
· MACD histogram expands sharply, forming a momentum climax
3. Every time this combination appears, Bitcoin builds a phase bottom and quickly reverses
---
Divergence typical case (March-April 2025) 👇
1. This is a standard textbook-level reversal
2. When the price makes a new low, RSI and MACD rise simultaneously, forming a classic bullish divergence
3. This signal triggers a V-shaped rebound and starts a new round of main uptrend
Currently, this structure has not yet appeared, the market is still in the momentum cleansing phase and has not formed a confirmed reversal signal.
---
Trading perspective 👇
1. I am not a 'pure technical analysis' believer
2. Indicators are like a prism to me, used to observe market sentiment and momentum reflections
3. Trading focuses on integrating multiple signals, rather than obsessing over a single tool
4. Every operation must align with macro data, market positions, and overall sentiment
5. Understanding how resonance and divergence shape reversals is key to grasping market dynamics
6. The market never bottoms for the sake of patterns, only builds a bottom for momentum exhaustion
---
Final reminder 👇
Current market divergence is severe:
Some people shout 'The bear market is coming'
Some insist 'The bull market is taking a break'
In fact, both can hold, the difference lies only in the time frame. Precisely for this reason, it is even more necessary to establish an independent judgment system to avoid blindly following market narratives.
What is your prediction for the true bottom of Bitcoin in this cycle? 👇
