Trade Update$
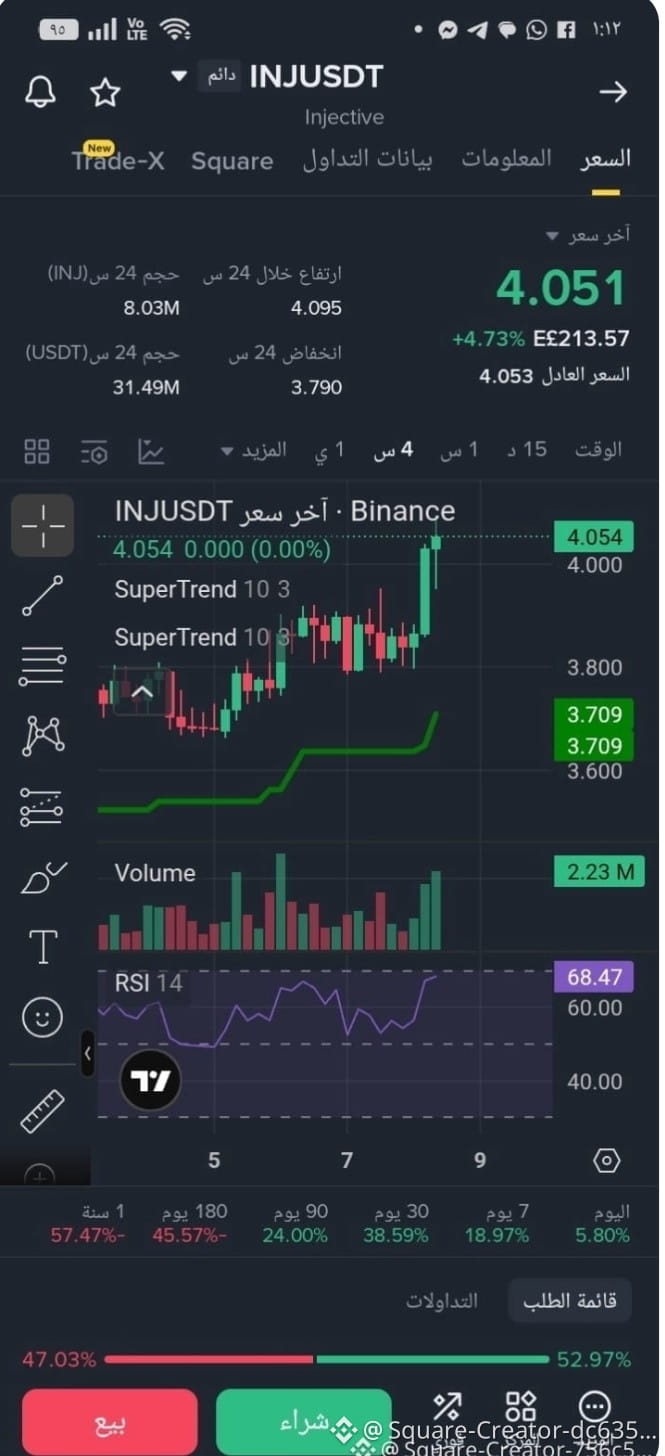
*Quick analysis of INJ/USDT from the chart:*
*1. Current situation from the chart*
Indicator Value Meaning
**Price** 4.051$ Bullish +4.73% today
**SuperTrend** Green line below price Bullish signal - trend is up
**RSI 14** 68.47 Close to overbought 70, but still some room
**Volume** 2.23M Large green candlestick with high volume = strong liquidity inflow
**24h High** 4.095$ Near the peak, if it breaks, it’ll soar
**24h Low** 3.790$ Support for today
*2. What does the chart say?*
1. *Strong breakout*: The last long green candlestick broke through the resistance at 4.00$ with high volume. This is a clear "breakout" move.
2. *SuperTrend turned green*: The green line is now below the price = confirmation that the trend has turned bullish on the 4-hour frame.
3. *RSI 68*: Still hasn't reached overbought 70. This means there’s still momentum for an upward move before a correction.
4. *Buying ratio 52.97%* greater than selling = buyers are currently in control.
*3. Upcoming scenarios*
*Positive scenario - continues to rise:*
If it holds above 4.05$ and closes a 4-hour candlestick above it, the next target is *4.20$ then 4.40$*.
Reason: No strong resistances until 4.40$ based on the daily frame.
*Negative scenario - correction:*
If it drops below 4.00$ = breakout failure. It will retest *3.85$ then 3.70$* SuperTrend support.
The RSI 68 indicates a correction could happen at any moment to take profits.
*4. What to do if you plan to enter?*
*Don’t enter market now*, the price is soaring. Wait for one of two:
1. *Enter with the correction*: If it drops to 3.95$ - 4.00$ and holds = excellent entry, stop at 3.85$
.
.
$INJ
*Quick analysis of INJ/USDT from the chart:*
*1. Current situation from the chart*
Indicator Value Meaning
**Price** 4.051$ Bullish +4.73% today
**SuperTrend** Green line below price Bullish signal - trend is up
**RSI 14** 68.47 Close to overbought 70, but still some room
**Volume** 2.23M Large green candlestick with high volume = strong liquidity inflow
**24h High** 4.095$ Near the peak, if it breaks, it’ll soar
**24h Low** 3.790$ Support for today
*2. What does the chart say?*
1. *Strong breakout*: The last long green candlestick broke through the resistance at 4.00$ with high volume. This is a clear "breakout" move.
2. *SuperTrend turned green*: The green line is now below the price = confirmation that the trend has turned bullish on the 4-hour frame.
3. *RSI 68*: Still hasn't reached overbought 70. This means there’s still momentum for an upward move before a correction.
4. *Buying ratio 52.97%* greater than selling = buyers are currently in control.
*3. Upcoming scenarios*
*Positive scenario - continues to rise:*
If it holds above 4.05$ and closes a 4-hour candlestick above it, the next target is *4.20$ then 4.40$*.
Reason: No strong resistances until 4.40$ based on the daily frame.
*Negative scenario - correction:*
If it drops below 4.00$ = breakout failure. It will retest *3.85$ then 3.70$* SuperTrend support.
The RSI 68 indicates a correction could happen at any moment to take profits.
*4. What to do if you plan to enter?*
*Don’t enter market now*, the price is soaring. Wait for one of two:
1. *Enter with the correction*: If it drops to 3.95$ - 4.00$ and holds = excellent entry, stop at 3.85$
.
.
$INJ