
💰 Current price: ~10.05 USDC
📈 Recent recovery: from a low of 8.42 to a high of 10.25 (+21.7%)
⏱️ Analyzed timeframes: 1H / 4H / 1D
---
📖 CONTEXT — WHAT IS LINK?
🔗 Chainlink is one of the key projects in the crypto ecosystem — the oracle infrastructure that connects blockchain smart contracts with real-world data.
📊 LINK is a token with solid fundamentals, used by hundreds of DeFi protocols and financial institutions for price data, weather, sports, and much more.
🚀 From the recent low of 8.42, the price has recovered to 10.25 — a move of +21.7% accompanied by increased volume and bullish technical signals across multiple timeframes.
🎯 The current situation presents a confirmed bullish structure on Daily and 4H — with a healthy correction underway that offers an optimal entry opportunity.
---
📊 DAILY ANALYSIS (1D) — BULLISH BREAKOUT WITH CONFIRMATION
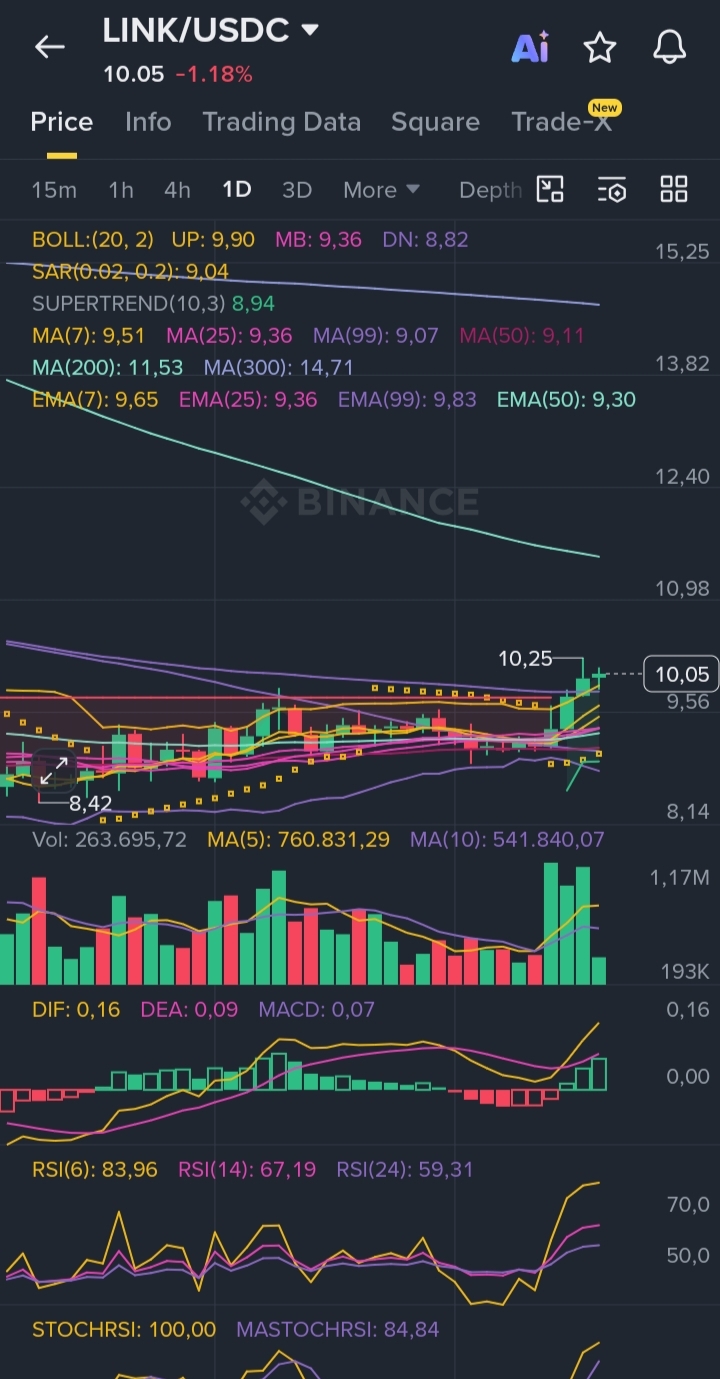
📌 On the daily, signals are bullish — this is a move with technical substance.
🟢 SuperTrend Daily: 8.94 — GREEN — the daily trend is bullish.
🟢 MACD Daily: DIF: 0.16 / DEA: 0.09 / Histogram: 0.07 — strongly bullish and expanding.
📊 Bollinger Daily: UP: 9.90 / MB: 9.36 / DN: 8.82
📍 Price of 10.05 has surpassed UP Bollinger Daily — sign of bullish strength.
📊 RSI(6) Daily: 83.96 — high, confirming momentum.
📊 RSI(14) Daily: 67.19 — solid, with room to rise.
📊 RSI(24) Daily: 59.31 — all three RSIs positive.
🔥 StochRSI Daily: 100.00 / MaStochRSI: 84.84 — at absolute maximum.
📊 Daily Volume: MA(5): 760K vs MA(10): 541K — participation 40% above average.
📍 Price is below MA(200): 11.53 and MA(300): 14.71 — major long-term resistances.
🟢 SAR Daily: 9.04 — below price, bullish.
🎯 Daily conclusion: Real bullish breakout with green SuperTrend, strong MACD, and increased volume. StochRSI at 100 signals momentum exhaustion short-term — likely correction before continuation. MA(200) at 11.53 is the next major resistance.
---
⏱️ 4H ANALYSIS — SOLID BULLISH STRUCTURE
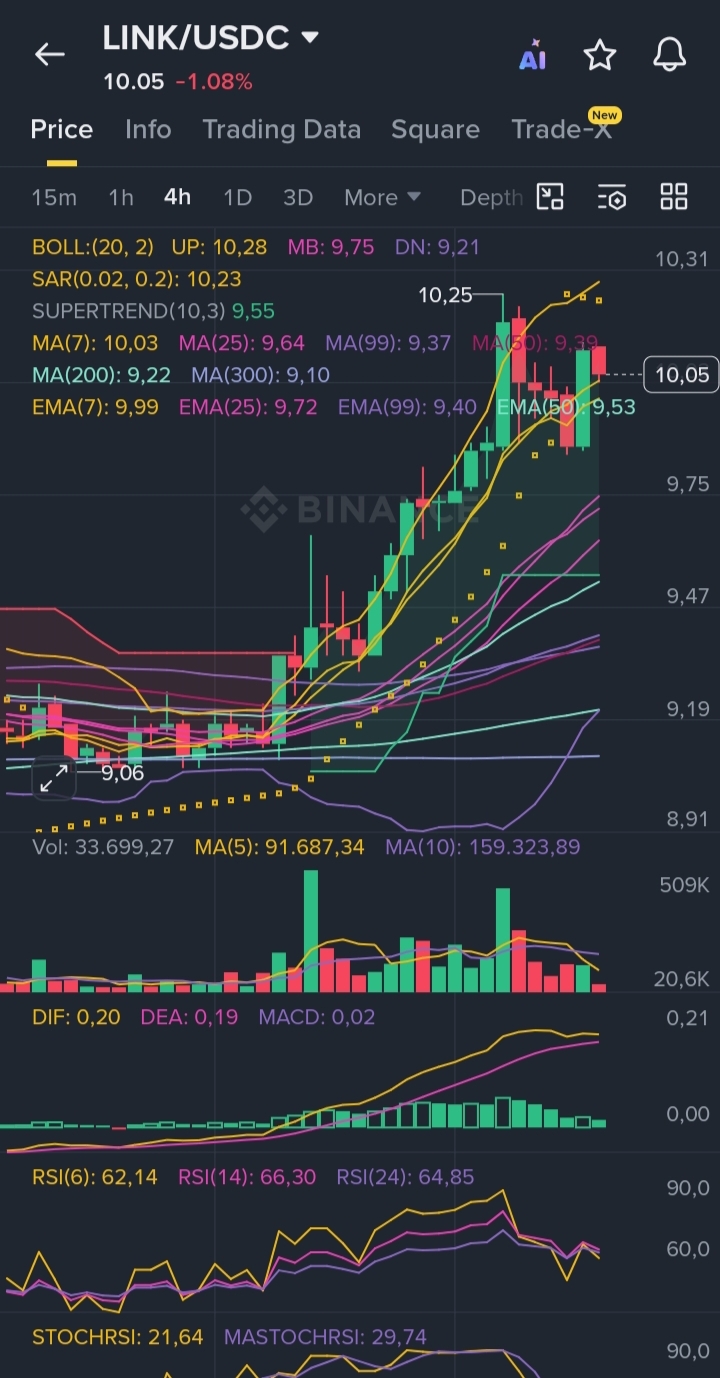
🕯️ On 4H, the bullish structure is clear and well-built.
🟢 SuperTrend 4H: 9.55 — GREEN.
🟢 MACD 4H: DIF: 0.20 / DEA: 0.19 / Histogram: 0.02 — solid bullish.
📊 Bollinger 4H: UP: 10.28 / MB: 9.75 / DN: 9.21
📍 Price of 10.05 is between MB and UP Bollinger 4H — a healthy zone.
📊 RSI(6) 4H: 62.14 — moderately bullish, with room to rise.
📊 RSI(14) 4H: 66.30 — solid.
📊 RSI(24) 4H: 64.85 — all three RSIs between 62-67 — healthy trend without excesses.
📊 StochRSI 4H: 21.64 / MaStochRSI: 29.74 — cooling off after the pump — optimal entry zone.
📊 4H Volume: MA(5): 91K vs MA(10): 159K — volume normalizing after the pump spike.
🎯 4H conclusion: StochRSI 4H at 21 in the context of a bullish structure with green SuperTrend = optimal LONG entry zone. Indicators have reset without the structure deteriorating.
---
⏱️ 1H ANALYSIS — ACTIVE BOUNCE
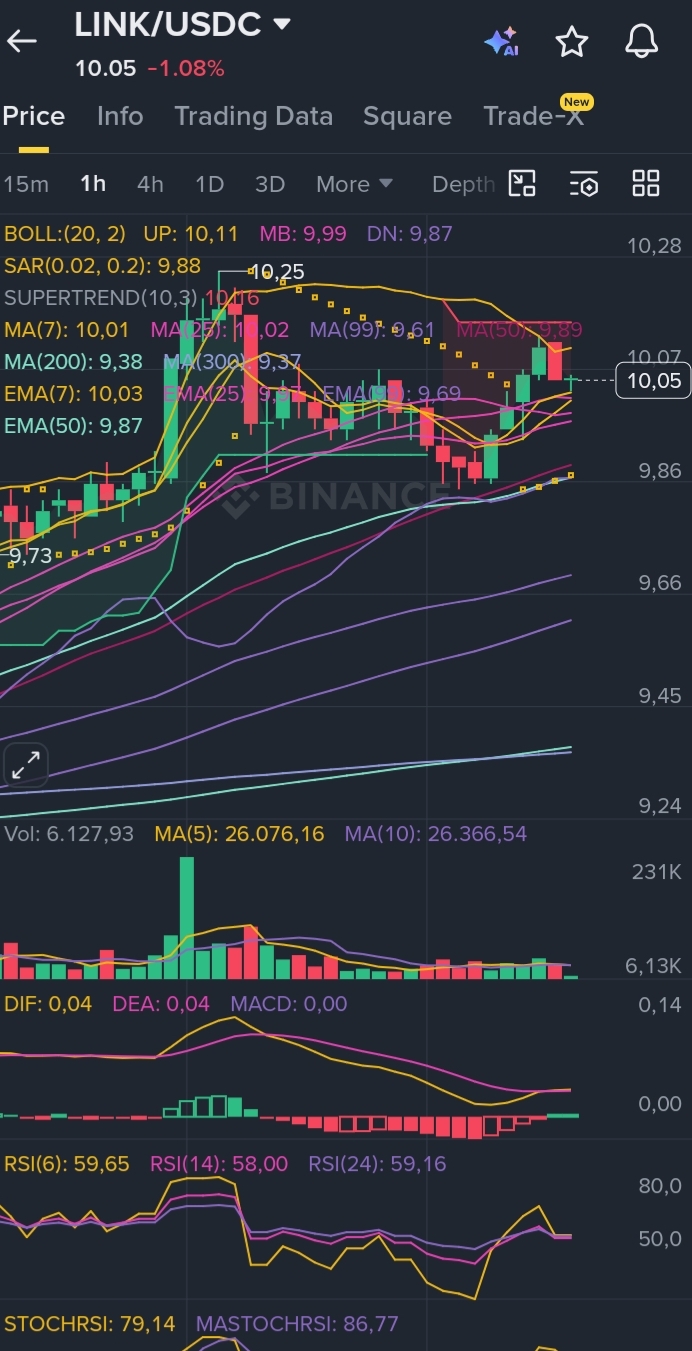
🕐 On 1H, the bounce from the recent low is already in progress.
📊 Bollinger 1H: UP: 10.11 / MB: 9.99 / DN: 9.87
📍 Price of 10.05 is between MB and UP Bollinger 1H — active recovery.
📊 StochRSI 1H: 79.14 / MaStochRSI: 86.77 — rising, confirms the bounce.
📊 RSI(6) 1H: 59.65 — neutral-bullish.
📊 RSI(14) 1H: 58.00 — balanced.
📊 RSI(24) 1H: 59.16 — all three RSIs around 59 — sign of orderly recovery.
🟢 SuperTrend 1H: 10.16 — green, watch closely — near price.
📊 MACD 1H: DIF: 0.04 / DEA: 0.04 / Histogram: 0.00 — neutral, at decision.
🎯 1H conclusion: Active bounce from the correction zone. SuperTrend 1H at 10.16 is close to price — a 1H candle closing below 9.99 (MB Bollinger 1H) would be a sign of caution.
---
🟢 LONG FUTURES SETUP — MAIN SCENARIO
🎯 Thesis: Green Daily and 4H SuperTrend + strong bullish MACD on both timeframes + StochRSI 4H reset to 21 + increased volume compared to average = solid bullish structure with LONG opportunity at pullback.
📌 Optimal entry zone: 9.75 – 10.05 (current zone / pullback)
🛑 Stop Loss: 9.50 — below MB Bollinger 4H and SuperTrend 4H
🎯 TP1: 10.25 — recent peak — close 35% of the position
🎯 TP2: 10.28 — UP Bollinger 4H — close 35% of the position
🎯 TP3: 11.53 — MA(200) Daily — major resistance — close the rest
📊 Risk:Reward ratio: approximately 1:2.5
⚙️ Recommended leverage: 3x – 5x maximum
📏 Position size: maximum 2-3% of capital at risk
✅ Entry rules:
✅ Daily SuperTrend must stay green
✅ Don’t enter if the price closes a 4H candle below SuperTrend 4H at 9.55
✅ StochRSI 4H must be below 50 at the time of entry — confirms you caught the pullback
✅ Check BTC — LINK has a high correlation with the market
✅ MA(200) Daily at 11.53 is major resistance — take partial profit there
---
🔴 SHORT FUTURES SETUP — ALTERNATIVE SCENARIO
📌 Low probability — bullish structure is solid on Daily and 4H.
📌 Trigger: Daily candle closing below SuperTrend Daily (8.94) with increased volume
📌 Entry zone: 8.80 – 8.94
🛑 Stop Loss: 9.40
🎯 TP1: 8.42 — recent low
🎯 TP2: 8.14 — DN Bollinger Daily
📊 R:R: approximately 1:2
⚠️ Only on complete invalidation of the bullish structure
---
💎 DCA SPOT ZONES — LONG-TERM ACCUMULATION
🛒 Chainlink is one of the few crypto projects with real institutional adoption and proven utility. Current prices represent a significant discount from historical highs — an opportunity for long-term investors.
🟦 Zone 1 — Current entry: 9.75 – 10.05
📍 MB Bollinger 4H — main technical support
📍 Suggested allocation: 30% of planned spot position
🟦 Zone 2 — Better entry: 9.21 – 9.50
📍 DN Bollinger 4H + SuperTrend 4H — major technical support
📍 Suggested allocation: 40% of planned spot position
🟦 Zone 3 — Maximum value: 8.42 – 8.82
📍 DN Bollinger Daily + recent low — maximum value zone
📍 Suggested allocation: 30% of planned spot position
---
📐 KEY LEVELS SUMMARY
🔴 Resistances:
🔴 10.11 — UP Bollinger 1H
🔴 10.25 — recent peak
🔴 10.28 — UP Bollinger 4H
🔴 11.53 — MA(200) Daily — major resistance
🔴 14.71 — MA(300) Daily
🟢 Supports:
🟢 9.99 — MB Bollinger 1H
🟢 9.87 — DN Bollinger 1H
🟢 9.75 — MB Bollinger 4H
🟢 9.55 — SuperTrend 4H
🟢 9.21 — DN Bollinger 4H
🟢 8.94 — SuperTrend Daily
🟢 8.82 — DN Bollinger Daily
🟢 8.42 — recent low
---
🧠 MOST PROBABLE SCENARIO
1️⃣ Consolidation between 9.75 and 10.25 in the next 12-24 hours — StochRSI Daily at 100 requires reset
2️⃣ StochRSI Daily is dropping towards 60-70 while price consolidates
3️⃣ Second attack on 10.25 — 10.28 with healthier momentum
4️⃣ If UP Bollinger 4H at 10.28 is surpassed with volume — extension towards MA(200) Daily at 11.53
5️⃣ MA(200) Daily at 11.53 is major resistance — expect a struggle there
---
⚖️ RISK MANAGEMENT RULES
🔒 Don’t force entries at the top with StochRSI Daily at 100 — patience for a pullback
🔒 Green Daily SuperTrend is the macro anchor — if it gives way, reevaluate everything
🔒 MA(200) Daily at 11.53 is a major resistance — take partial profit there mandatory
🔒 Strong Daily MACD with expanding histogram — sign the move has substance
🔒 Don’t use high leverage — MA(200) can reject price violently
---
❗ DISCLAIMER
⚠️ This analysis is for educational and informational purposes only.
⚠️ This does not constitute financial advice or a buy/sell recommendation.
⚠️ Trading cryptocurrencies involves significant risks, including losing your entire capital.
⚠️ Always do your own research before any investment decision.
⚠️ Don’t invest more than you can afford to lose.
---
📊 Analysis conducted by #NexusBull | Binance Square
🔔 Watch for daily setups and multi-timeframe analyses
💬 LINK — to MA(200) at 11.53 or prolonged consolidation? Write in the comments!
#ADPPayrollsSurge #IranDealHormuzOpen #IranDealHormuzOpen #BinanceLaunchesGoldvs.BTCTradingCompetition $LINK $BTC $ETH