Current Trend Analysis
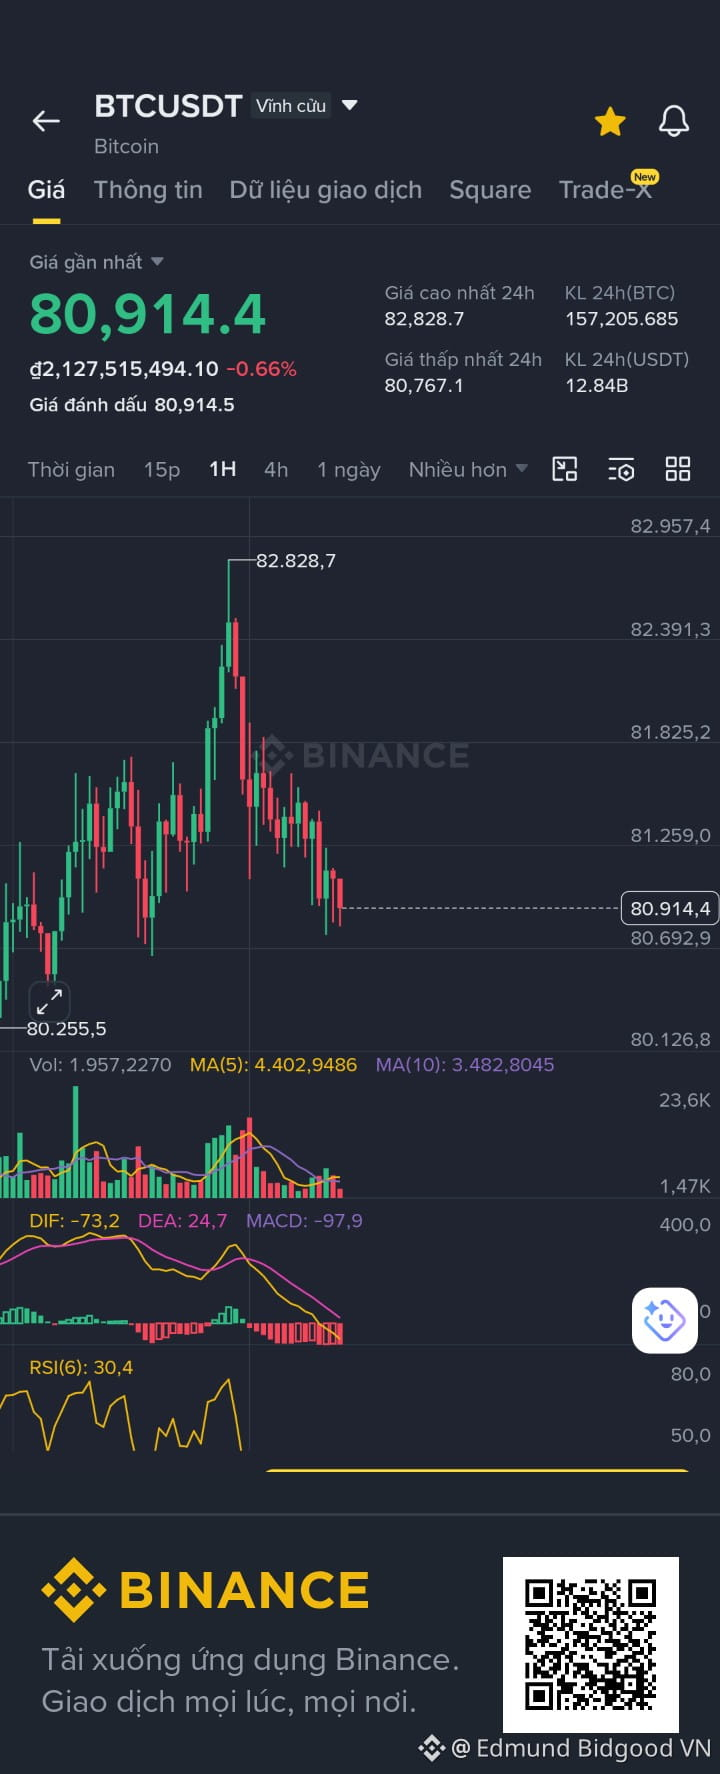
Price Structure: BTC is in a short-term correction after recently peaking around $82,828. The price has been consistently making lower highs and lower lows on the 15-minute chart.
RSI Indicator: On both timeframes, the RSI is at a low level (around 30-37), nearing the oversold zone. This indicates that selling pressure is dominant, but we might be approaching a point for a potential technical bounce.
MACD: Both the DIF and DEA lines are below the zero line, with the red histogram extending, confirming that the short-term downtrend remains strong.
Important Support and Resistance Zones
Nearby Resistance: The $81,500 - $81,800 zone. This is the price area that was just breached and is now acting as a barrier for any potential bounce.
Strong Support: The $80,250 - $80,700 zone. This is an old low on the 1-hour chart and serves as an important psychological level. If this area breaks, the price could drop deeper into the lower 70's.
Trading Strategy (For Reference)
Since the price is hovering near support but hasn't shown any clear reversal signals, you might consider two scenarios:
Scenario 1: Long on a bounce when a bullish signal appears
Entry: Wait for price reaction in the $80,250 - $80,750 zone. If a bullish candlestick or RSI divergence appears on a smaller timeframe (5m/15m), you can enter.
Take Profit (TP): $81,600 or further out at $82,200.
Stop Loss (SL): $80,000 (below the old low to avoid getting stopped out).
Scenario 2: Short in the direction of the trend when a pullback occurs
Entry: Wait for the price to retrace and test the resistance zone at $81,400 - $81,600 and show signs of rejection.
Take Profit (TP): $80,800 and $80,300.
Stop Loss (SL): $82,000 $BTC
Price Structure: BTC is in a short-term correction after recently peaking around $82,828. The price has been consistently making lower highs and lower lows on the 15-minute chart.
RSI Indicator: On both timeframes, the RSI is at a low level (around 30-37), nearing the oversold zone. This indicates that selling pressure is dominant, but we might be approaching a point for a potential technical bounce.
MACD: Both the DIF and DEA lines are below the zero line, with the red histogram extending, confirming that the short-term downtrend remains strong.
Important Support and Resistance Zones
Nearby Resistance: The $81,500 - $81,800 zone. This is the price area that was just breached and is now acting as a barrier for any potential bounce.
Strong Support: The $80,250 - $80,700 zone. This is an old low on the 1-hour chart and serves as an important psychological level. If this area breaks, the price could drop deeper into the lower 70's.
Trading Strategy (For Reference)
Since the price is hovering near support but hasn't shown any clear reversal signals, you might consider two scenarios:
Scenario 1: Long on a bounce when a bullish signal appears
Entry: Wait for price reaction in the $80,250 - $80,750 zone. If a bullish candlestick or RSI divergence appears on a smaller timeframe (5m/15m), you can enter.
Take Profit (TP): $81,600 or further out at $82,200.
Stop Loss (SL): $80,000 (below the old low to avoid getting stopped out).
Scenario 2: Short in the direction of the trend when a pullback occurs
Entry: Wait for the price to retrace and test the resistance zone at $81,400 - $81,600 and show signs of rejection.
Take Profit (TP): $80,800 and $80,300.
Stop Loss (SL): $82,000 $BTC