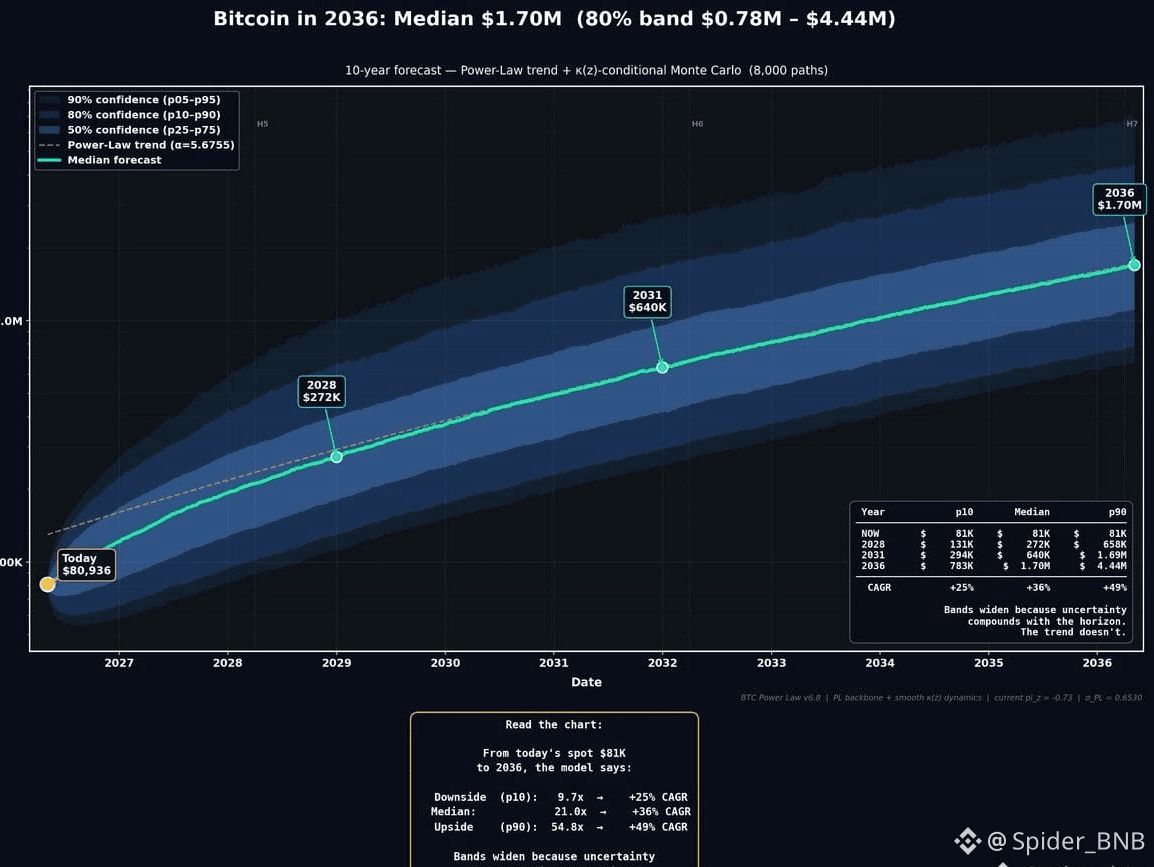
This chart highlights the **Bitcoin Power Law** model, a long-term valuation framework that suggests $BTC is following a predictable, non-linear growth curve.
Unlike standard linear charts, this log-scale projection treats Bitcoin as an asset governed by natural scaling laws.
### **The 10-Year Roadmap (Median Forecast)**
Based on the current spot of **$81,000**, the model projects the following milestones:
* **2028:** **$272,000** (The post-halving peak target).
* **2031:** **$640,000** (The transition toward institutional dominance).
* **2036:** **$1.70 Million** (The median long-term equilibrium).
### **Key Takeaways**
* **Power-Law Trend:** The red dashed line (\alpha = 5.6755) represents the historical "fair value." Currently, BTC is sitting right at the bottom of the confidence bands, suggesting it is technically **undervalued** relative to the long-term trend.
* **Risk/Reward:** Even in the "Downside" (p10) scenario, the model suggests a **25% CAGR**, outperforming almost every traditional asset class over a 10-year horizon.
* **Volatility Bands:** The widening blue bands account for "Black Swan" events and market euphoria. The upper "p90" band for 2036 reaches a staggering **$4.44 Million**.
### **High-Impact Post Draft** 🚀
> **$1.7 MILLION BTC BY 2036? THE MATH SAYS YES.** 📊🔥
> This isn't hype; it's a **Power Law Trend**. While the market panics over daily candles, the 10-year Monte Carlo simulation (8,000 paths) confirms we are following a mathematical growth curve.
> **The Milestones:**
> 📍 **2028:** $272K
> 📍 **2031:** $640K
> 📍 **2036:** $1.7M
> We are currently at **$81K**, sitting at the very bottom of the 50% confidence band. Historically, this is the "buy zone" before the next major leg up to the median line.
> **The trend doesn't lie—uncertainty compounds, but the Power Law holds.** 💎🙌
#SPIDER_BNB
Unlike standard linear charts, this log-scale projection treats Bitcoin as an asset governed by natural scaling laws.
### **The 10-Year Roadmap (Median Forecast)**
Based on the current spot of **$81,000**, the model projects the following milestones:
* **2028:** **$272,000** (The post-halving peak target).
* **2031:** **$640,000** (The transition toward institutional dominance).
* **2036:** **$1.70 Million** (The median long-term equilibrium).
### **Key Takeaways**
* **Power-Law Trend:** The red dashed line (\alpha = 5.6755) represents the historical "fair value." Currently, BTC is sitting right at the bottom of the confidence bands, suggesting it is technically **undervalued** relative to the long-term trend.
* **Risk/Reward:** Even in the "Downside" (p10) scenario, the model suggests a **25% CAGR**, outperforming almost every traditional asset class over a 10-year horizon.
* **Volatility Bands:** The widening blue bands account for "Black Swan" events and market euphoria. The upper "p90" band for 2036 reaches a staggering **$4.44 Million**.
### **High-Impact Post Draft** 🚀
> **$1.7 MILLION BTC BY 2036? THE MATH SAYS YES.** 📊🔥
> This isn't hype; it's a **Power Law Trend**. While the market panics over daily candles, the 10-year Monte Carlo simulation (8,000 paths) confirms we are following a mathematical growth curve.
> **The Milestones:**
> 📍 **2028:** $272K
> 📍 **2031:** $640K
> 📍 **2036:** $1.7M
> We are currently at **$81K**, sitting at the very bottom of the 50% confidence band. Historically, this is the "buy zone" before the next major leg up to the median line.
> **The trend doesn't lie—uncertainty compounds, but the Power Law holds.** 💎🙌
#SPIDER_BNB