
m1gu3l4ng3l
66 Posts

m1gu3l4ng3l
80% psicología / 20% análisis técnico 📊✅

Top 30D Traders by Volume
High-Frequency Trader
8.4 Years
5 Following
18 Followers
89 Liked
1 Badges
Posts
All
Quotes
When you feel you don't understand something from the chart and you're not sure. Your best tool and option is to use the Trading Demo tool and don't be embarrassed to use it ;) #DYOR
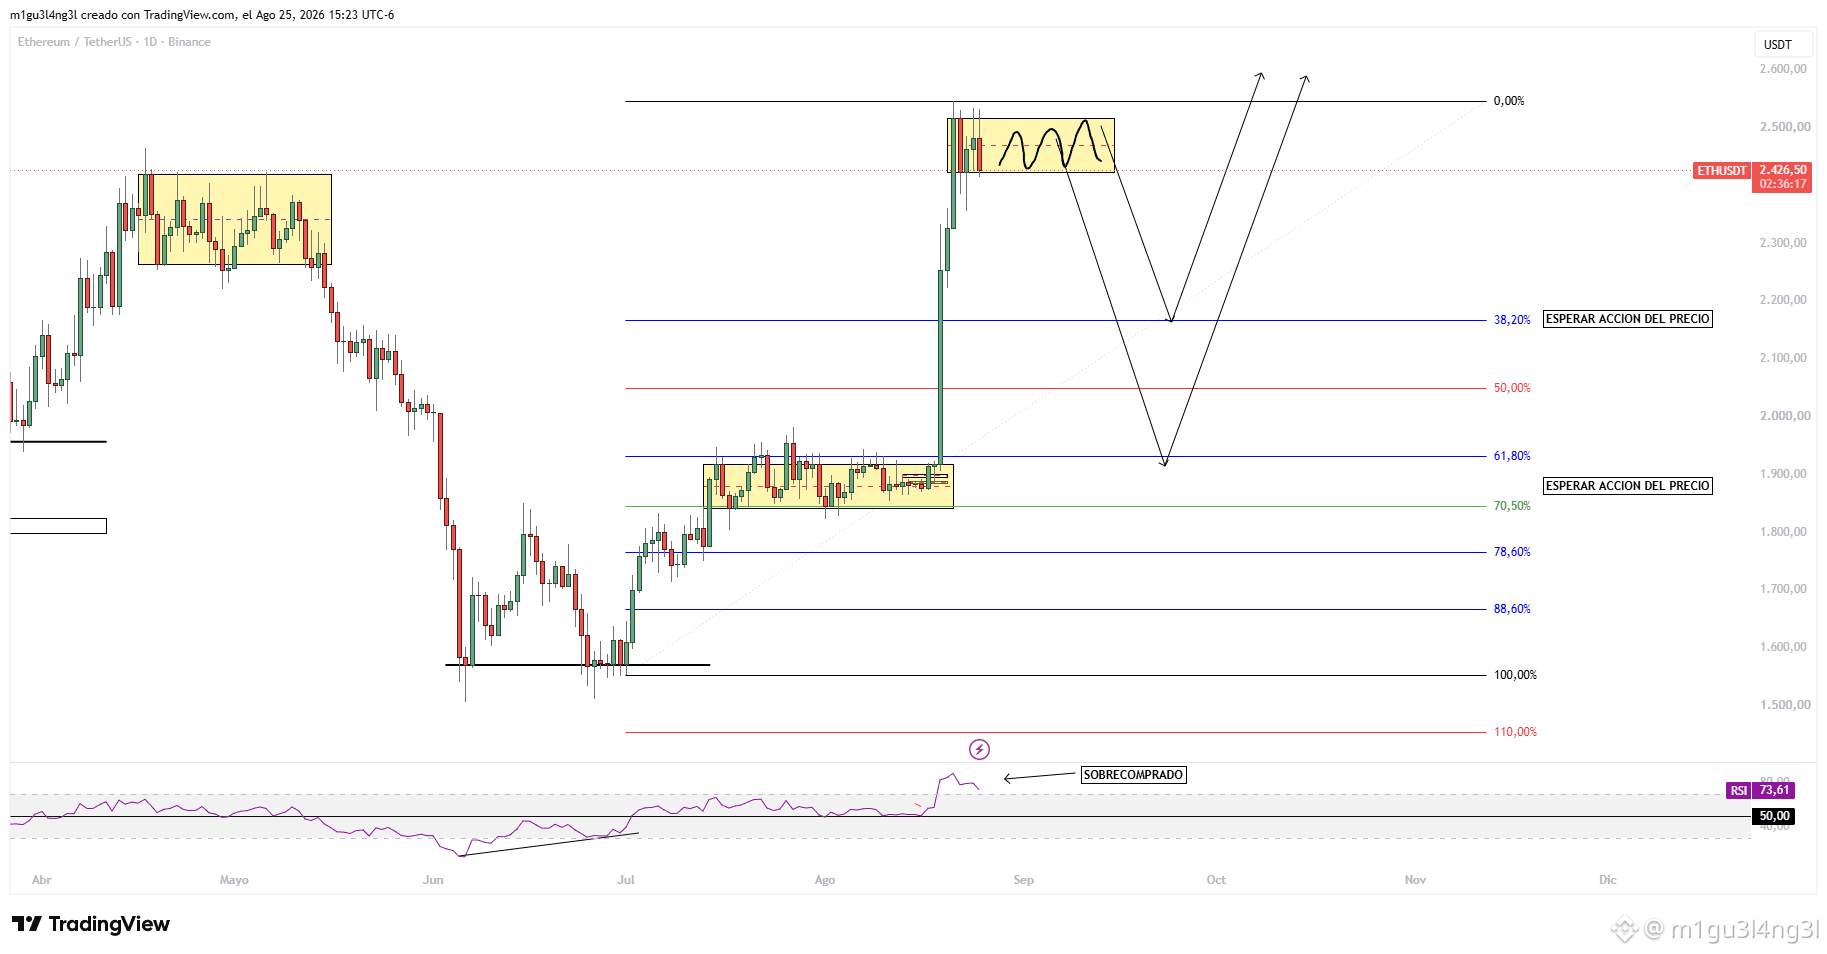
Patience will pay off; we need to look for better levels before positioning ourselves in the market. The best thing is to wait for an optimal HL point to enter these weekly and monthly movements that could develop this year. Let’s not try to guess what will happen or what the next move will be. The chart will tell you + the action of the price. I wouldn’t try to buy right now knowing that I’m at a strong resistance. (If the price keeps going up personally, I keep extending the Fibonacci until I reach a pullback and better levels to buy. #DYOR #ETH $ETH )
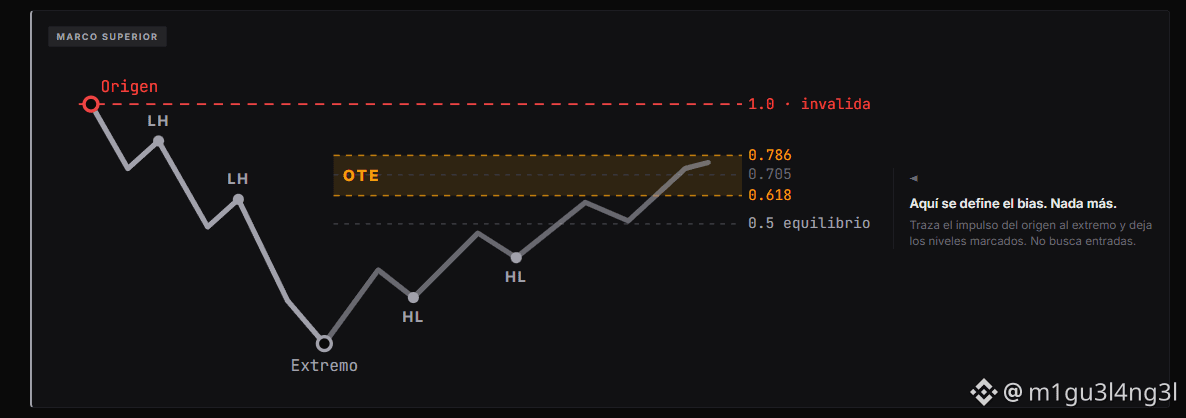
Do you use multiple timeframes? What do you think about using 1D - 4H - 15M?
1D: Define BIAS (Bullish or Bearish)
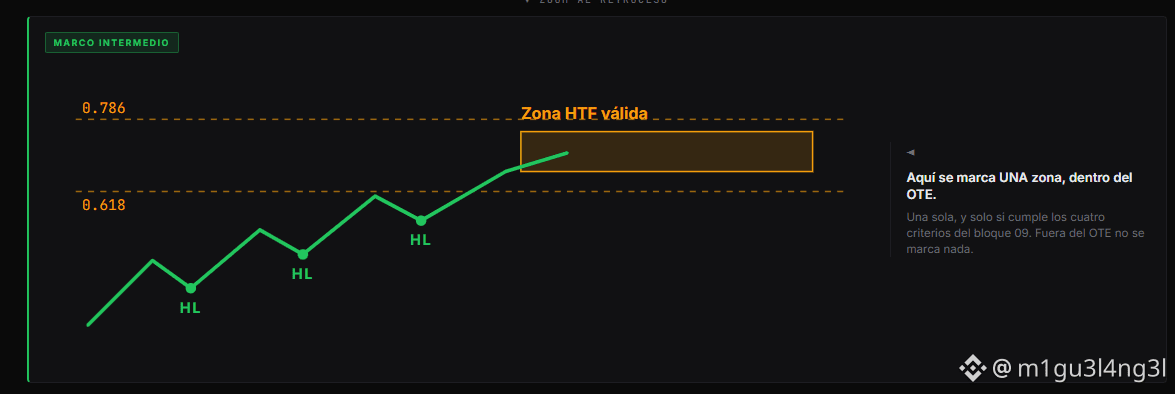
4H: Define buy or sell zones within your daily OTE.
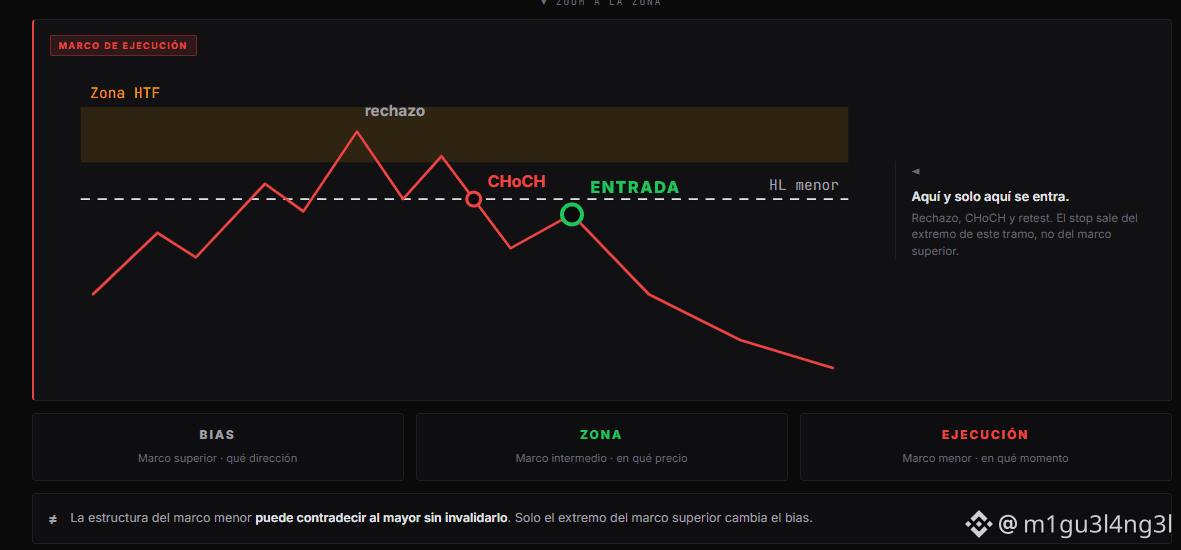
15M: Define your HTF or entry within the daily OTE and the 4H entry zone. This way we reduce risk.
TAKE PROFIT = This would be your new structural point for the timeframe of your BIAS.
STOP LOSS = You keep it on M15 at your last structural point of that timeframe to reduce risk and improve overall profit.
1D: Define BIAS (Bullish or Bearish)
4H: Define buy or sell zones within your daily OTE.
15M: Define your HTF or entry within the daily OTE and the 4H entry zone. This way we reduce risk.
TAKE PROFIT = This would be your new structural point for the timeframe of your BIAS.
STOP LOSS = You keep it on M15 at your last structural point of that timeframe to reduce risk and improve overall profit.
In the long term, good things are being defined after a 100% pullback, maintaining the bullish structure, and only 7 days are left to close the monthly candle—if it closes like this or higher, we would be talking about a strong engulfing pattern, a good sign for the long term and the coming months. Obviously, it will be a bit slower after having had a 100% pullback; despite everything, the trend weakened a little, but with a daily timeframe turning from bearish to bullish as we had last week. We could be looking for that HL so we don’t miss the impressive momentum that could come in the next few months. :) #DYOR .
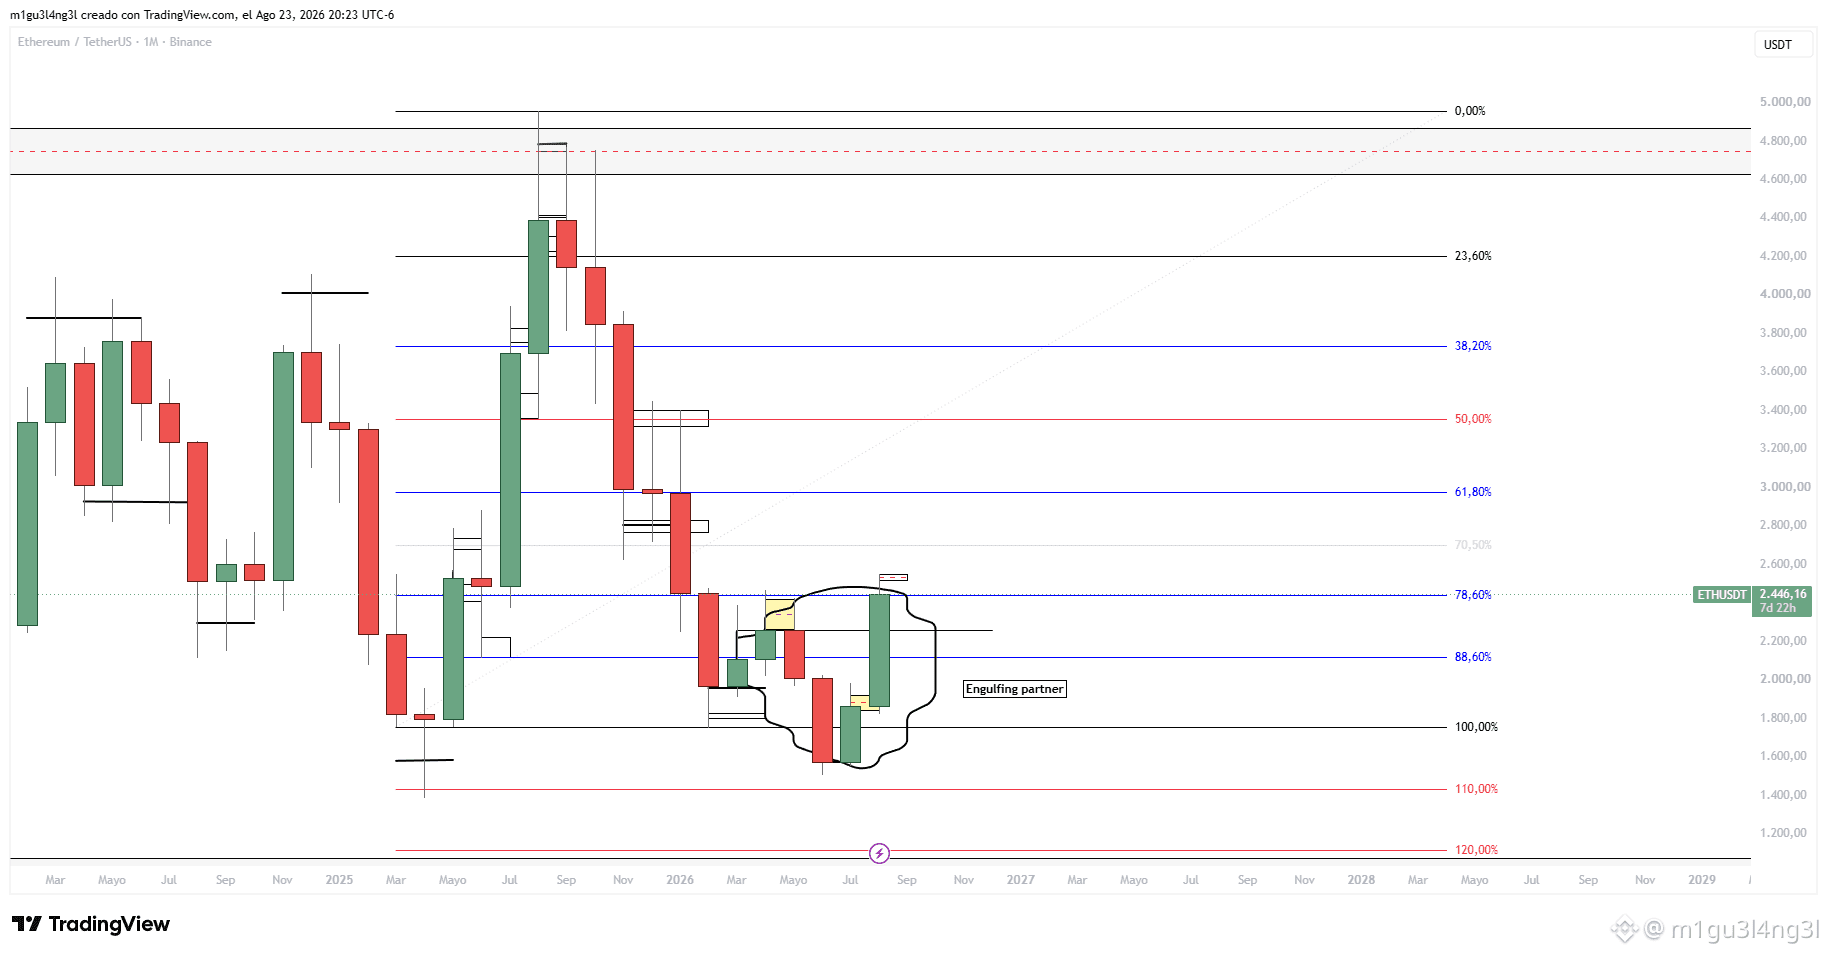
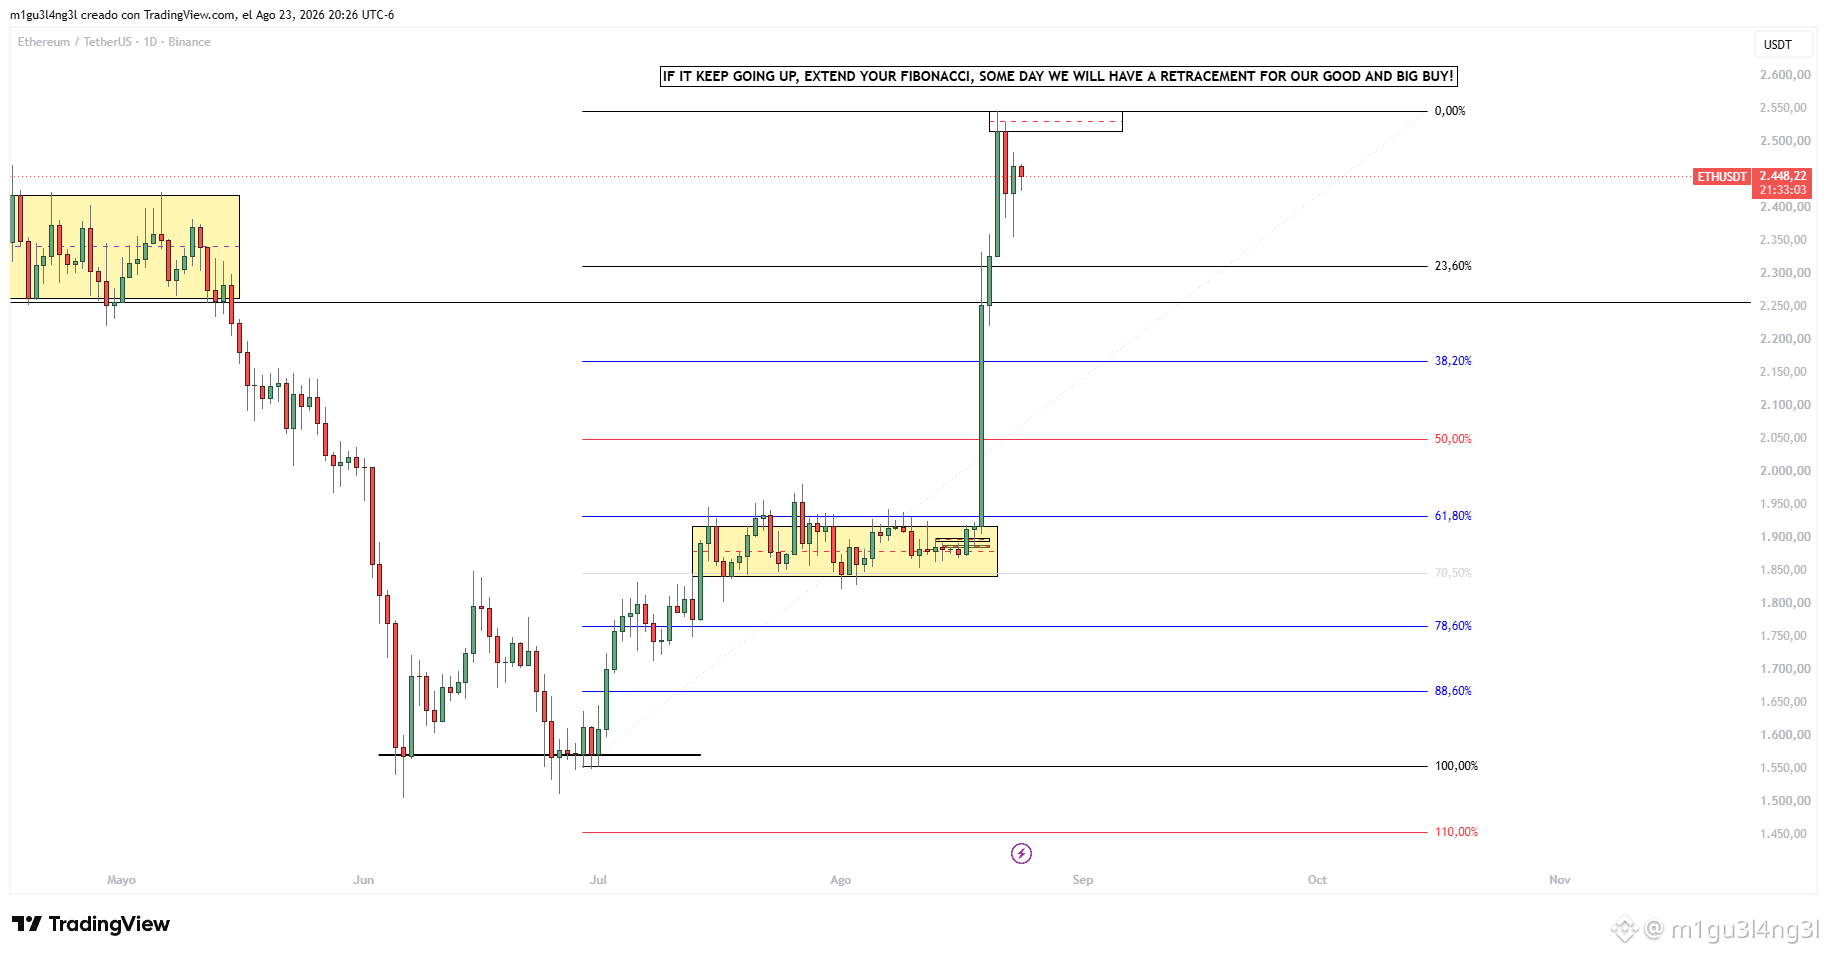
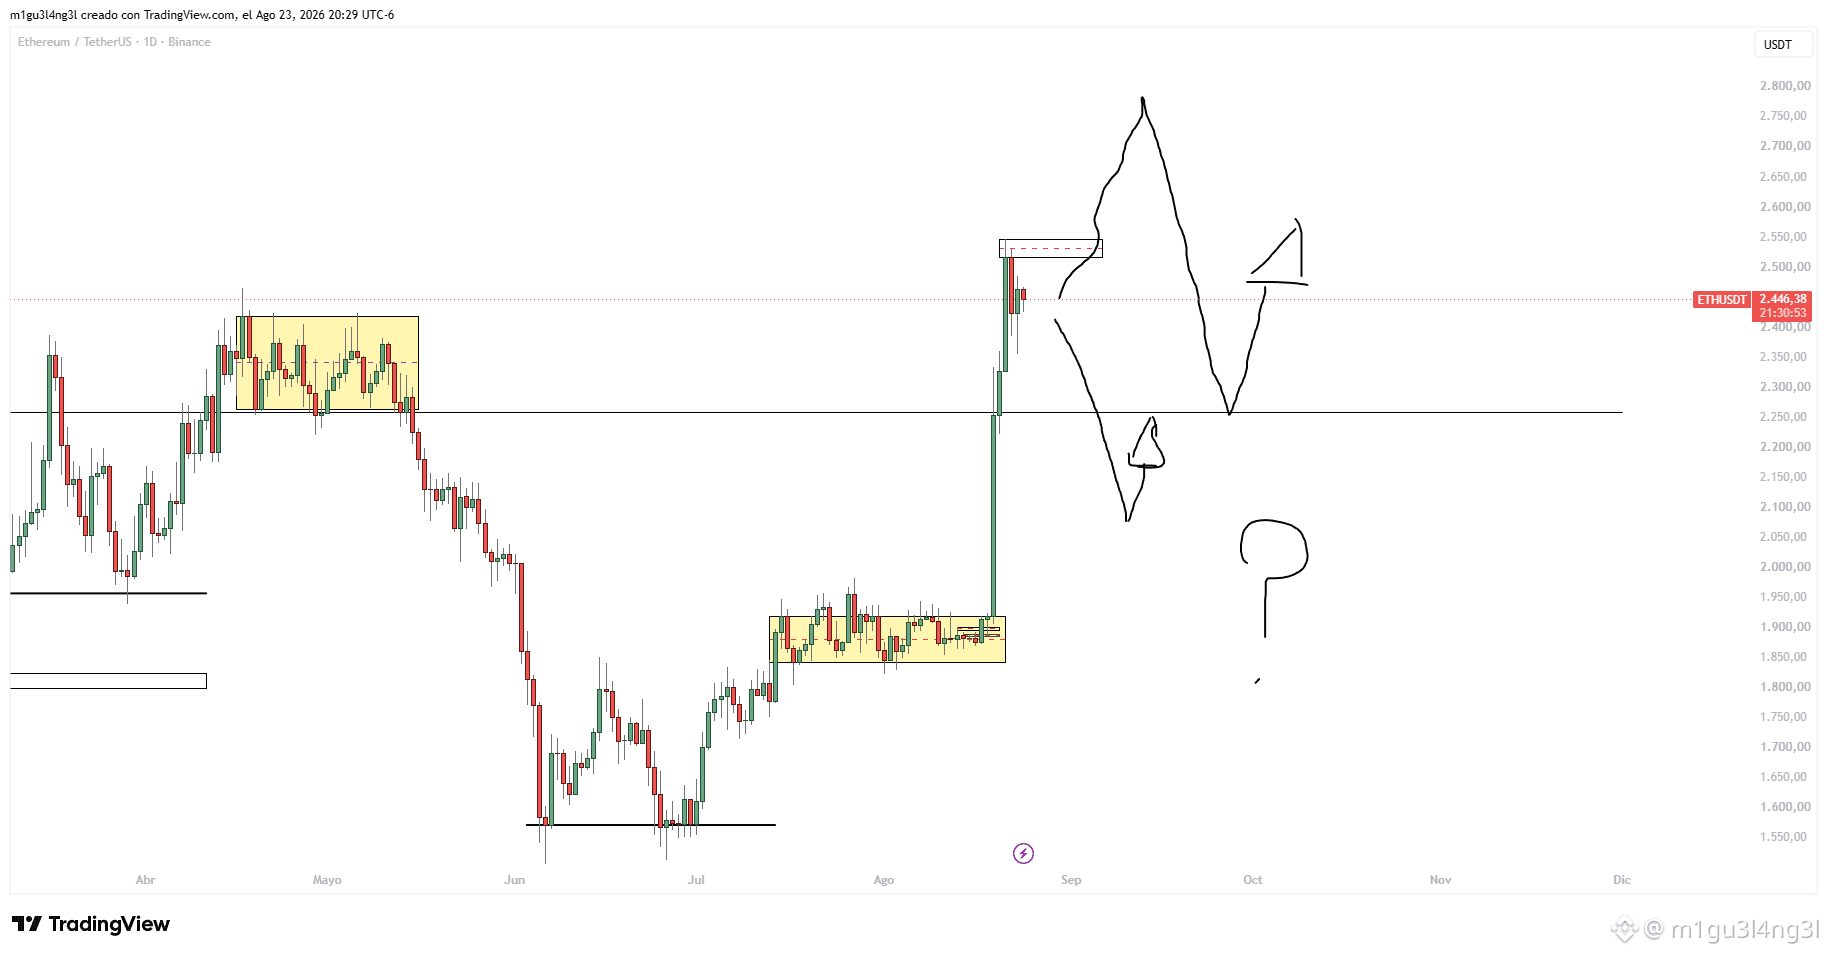
Lately I see that any upturn/dip they call manipulation hahaha... Why? I think all markets have bullish/bearish phases where there are points where institutions are interested in selling or buying; with them and in their favor is that you have to trade. Now if the price doesn’t do what you want, they call it manipulation. 🤣 (If this were easy, all of us would have been millionaires many years ago, right?)... This could even go up to 2,600 - 2,800 even 3,200, since in the Monthly and Weekly trend we are bullish and we could be within that new impulse of those timeframes…. before they give us that new daily higher low to buy; if it gives it to us earlier, even better.
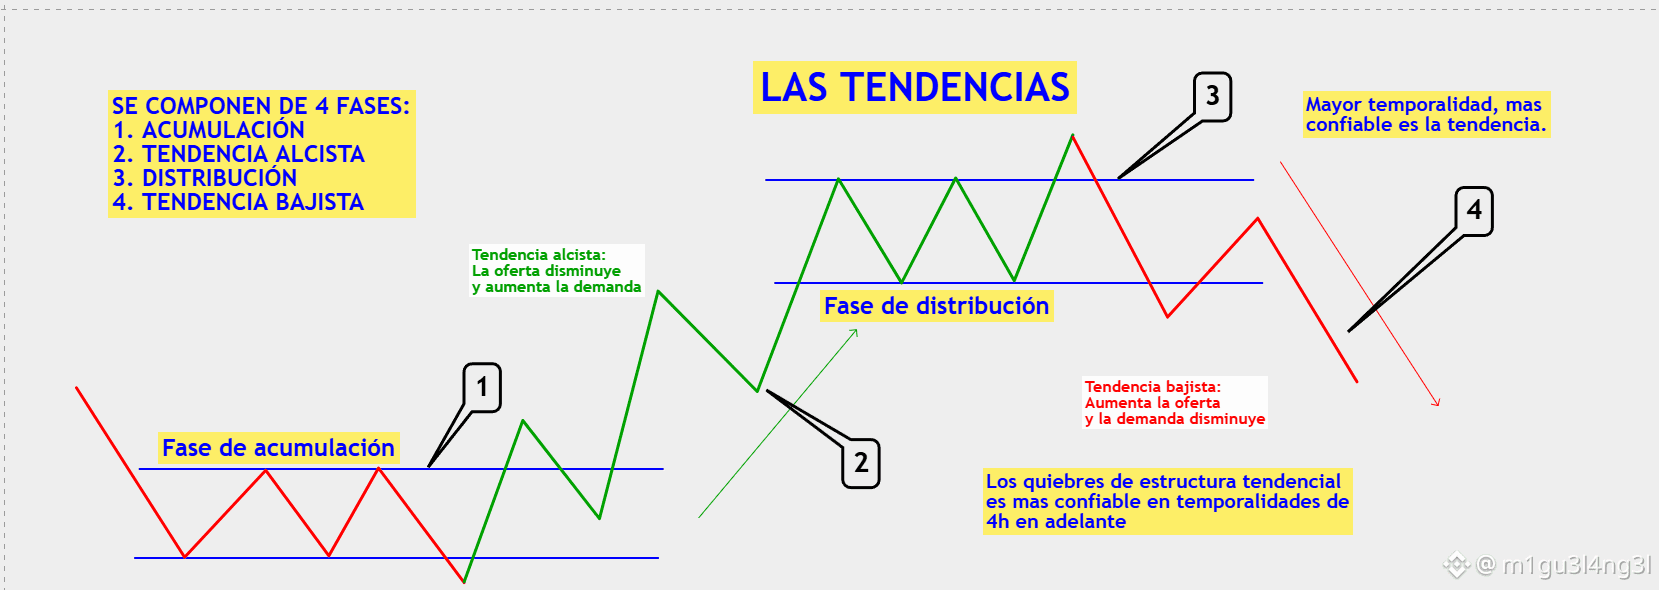
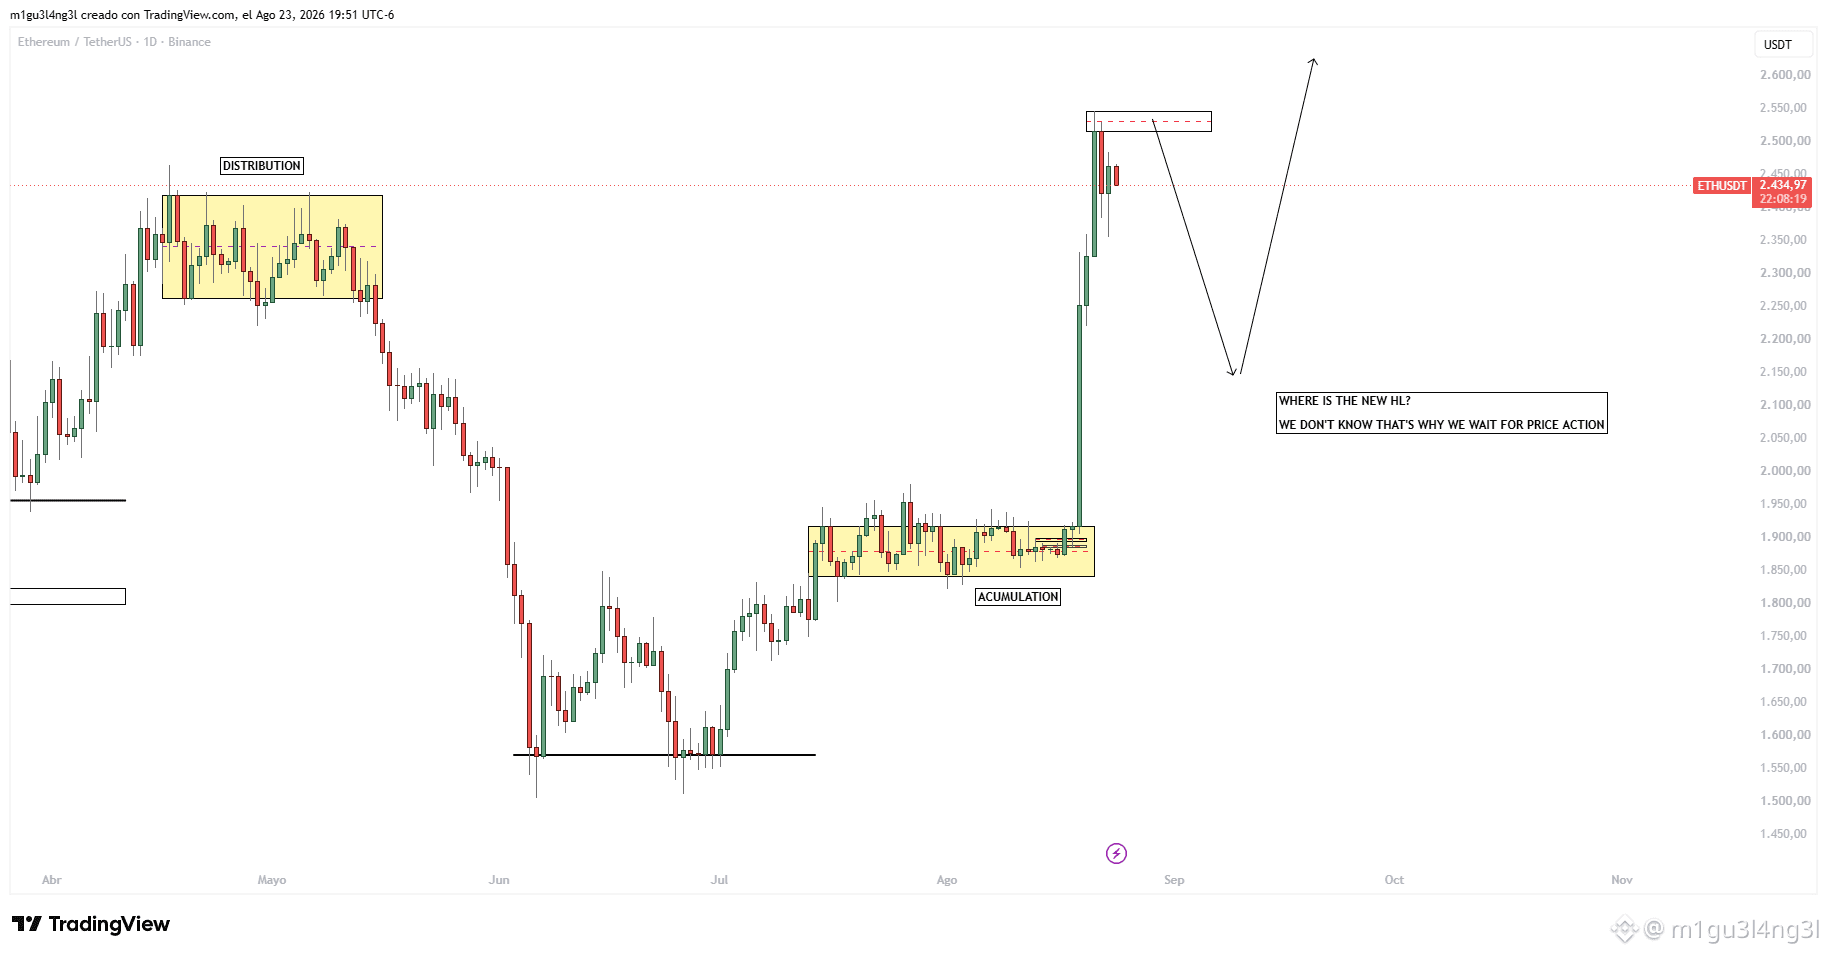
Why I DIDN'T sell ETH at the 50% Fibonacci (?)
My daily BIAS was bearish. I was looking for sells. And yet I bought. Let me explain.
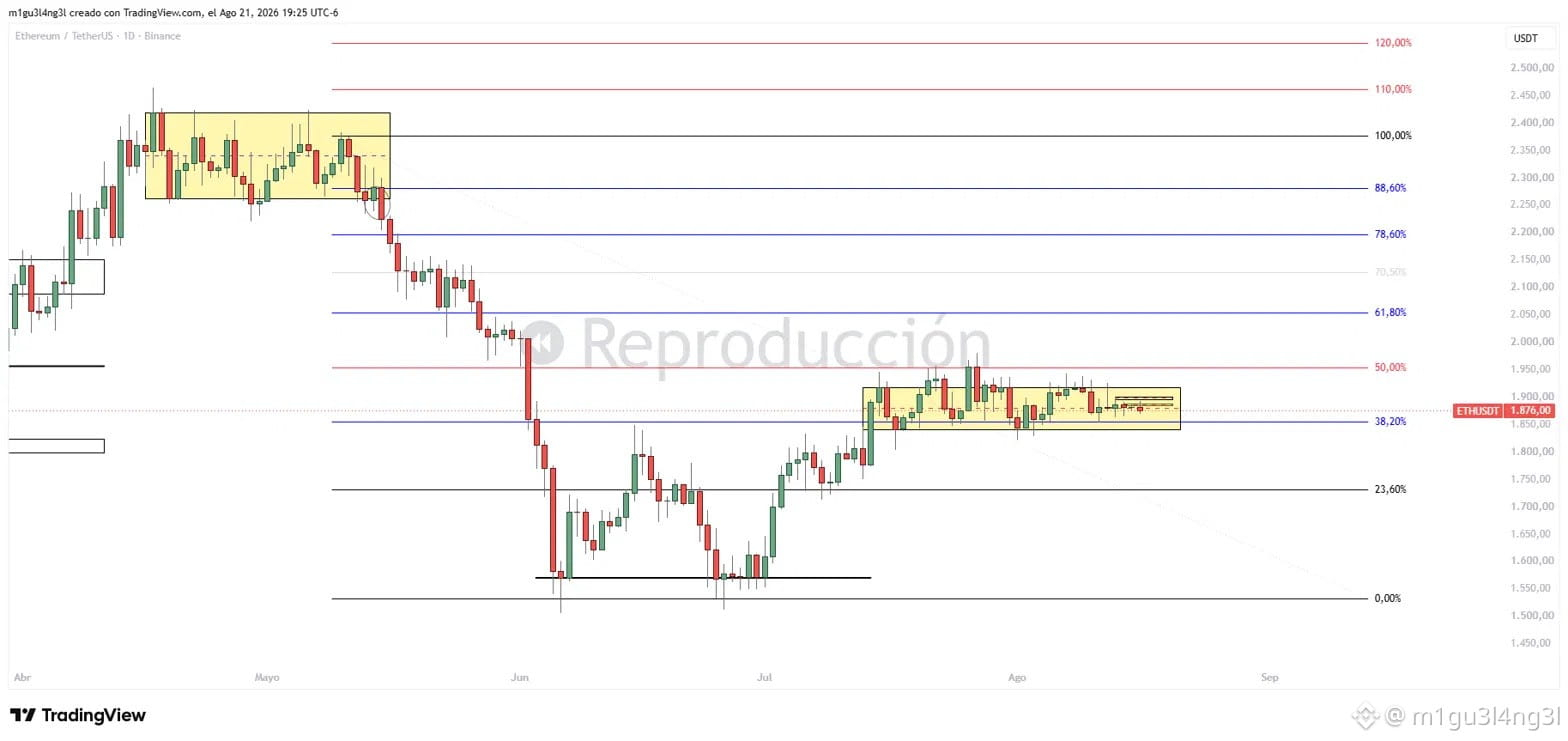
All my analysis comes from a bearish impulse on the daily: 2.375 → 1.530. On that impulse I draw Fibonacci. My sell zone is not any level: it’s the OTE, between 61.8% (2.055) and 78.6% (2.196).
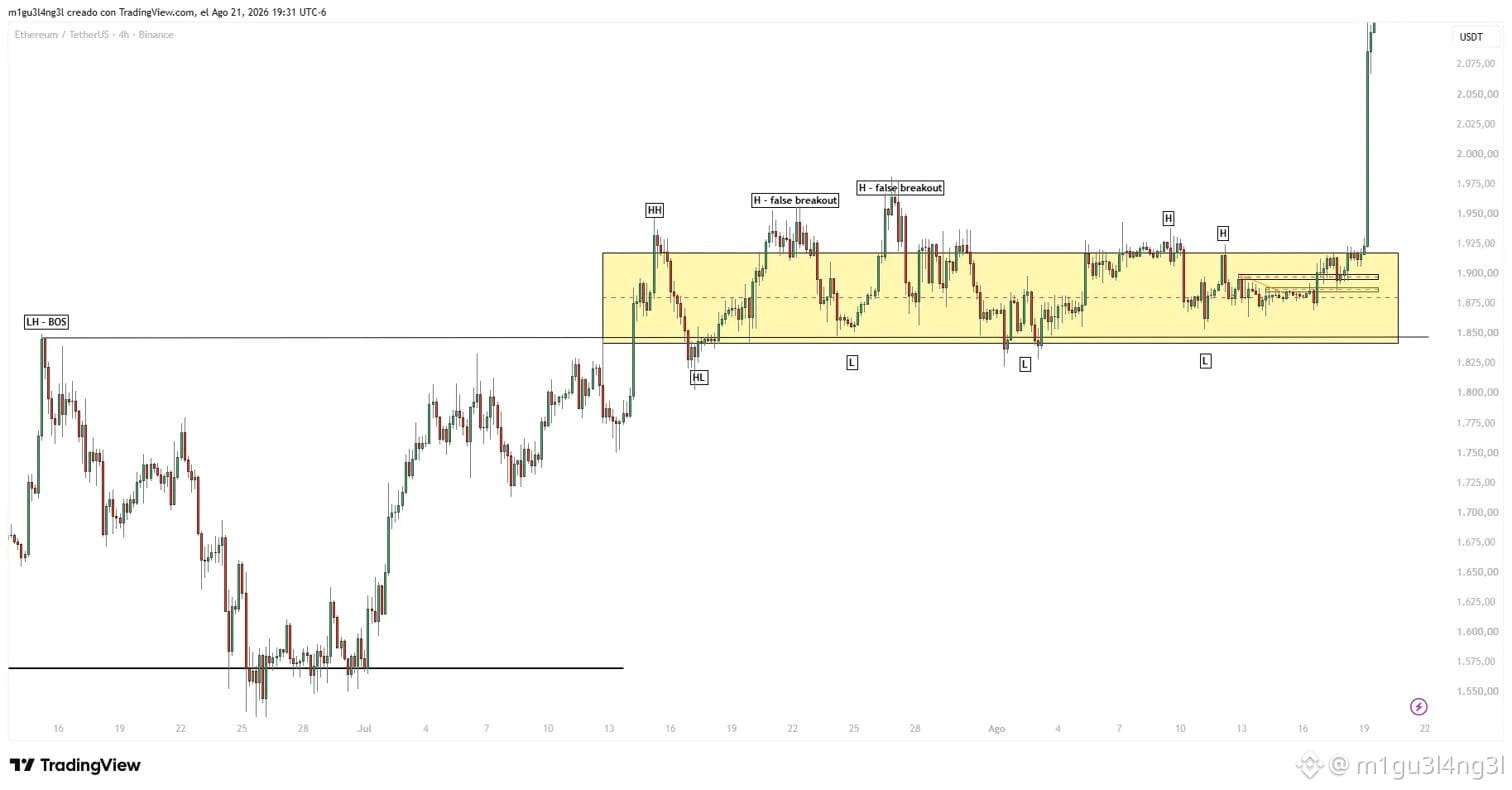
Price never reached it. It stalled at 50% (1.953) and stayed in a range for an entire month, between 1.840 and 1.925 on 4H.
50% is equilibrium: the exact point where buyers and sellers are tied. It’s not an entry, it’s a fight with no winner. And inside a range you don’t trade. You trade the range’s exit.
Also, the range structure wasn’t bearish:
- The highs were broken and then reversed twice. False breakouts = liquidity.
- The lows were rising.
- There was never a bearish CHoCH inside the range.
- On 4H, 1H, and 15M there was an HH-HL sequence. Bullish structure.
And the weekly closed the case: price was at 88.6% of the larger retracement, a statistically invalidation zone, with clear bullish divergence as well. For me, that last bearish leg was a trap, not a continuation.
Four timeframes. Zero permission to sell.
So I took the buy knowing I was going against my daily BIAS. SL very tight below the last swing low of the range, and target at 61.8% (2.052): the same level where I was supposed to sell.
Price broke the range and didn’t stop. It went through 61.8%, 78.6%, 88.6%, broke 100% at 2.375 (the level that invalidates my bearish BIAS), and reached 2.517, close to the 120% extension. More than 34%.
Selling at 50% “because the daily is bearish” wouldn’t have been a controlled loss. It would’ve been a liquidation.
What I take away: the BIAS tells you where you want to operate, not that you have to.
And something uncomfortable that also needs to be said: it won, but it was outside my checklist. In my logbook it goes down as a trade against process, separate from statistics. Winning doesn’t make it correct.
This is not financial advice. It’s only my opinion and my way. $ETH
My daily BIAS was bearish. I was looking for sells. And yet I bought. Let me explain.
All my analysis comes from a bearish impulse on the daily: 2.375 → 1.530. On that impulse I draw Fibonacci. My sell zone is not any level: it’s the OTE, between 61.8% (2.055) and 78.6% (2.196).
Price never reached it. It stalled at 50% (1.953) and stayed in a range for an entire month, between 1.840 and 1.925 on 4H.
50% is equilibrium: the exact point where buyers and sellers are tied. It’s not an entry, it’s a fight with no winner. And inside a range you don’t trade. You trade the range’s exit.
Also, the range structure wasn’t bearish:
- The highs were broken and then reversed twice. False breakouts = liquidity.
- The lows were rising.
- There was never a bearish CHoCH inside the range.
- On 4H, 1H, and 15M there was an HH-HL sequence. Bullish structure.
And the weekly closed the case: price was at 88.6% of the larger retracement, a statistically invalidation zone, with clear bullish divergence as well. For me, that last bearish leg was a trap, not a continuation.
Four timeframes. Zero permission to sell.
So I took the buy knowing I was going against my daily BIAS. SL very tight below the last swing low of the range, and target at 61.8% (2.052): the same level where I was supposed to sell.
Price broke the range and didn’t stop. It went through 61.8%, 78.6%, 88.6%, broke 100% at 2.375 (the level that invalidates my bearish BIAS), and reached 2.517, close to the 120% extension. More than 34%.
Selling at 50% “because the daily is bearish” wouldn’t have been a controlled loss. It would’ve been a liquidation.
What I take away: the BIAS tells you where you want to operate, not that you have to.
And something uncomfortable that also needs to be said: it won, but it was outside my checklist. In my logbook it goes down as a trade against process, separate from statistics. Winning doesn’t make it correct.
This is not financial advice. It’s only my opinion and my way. $ETH
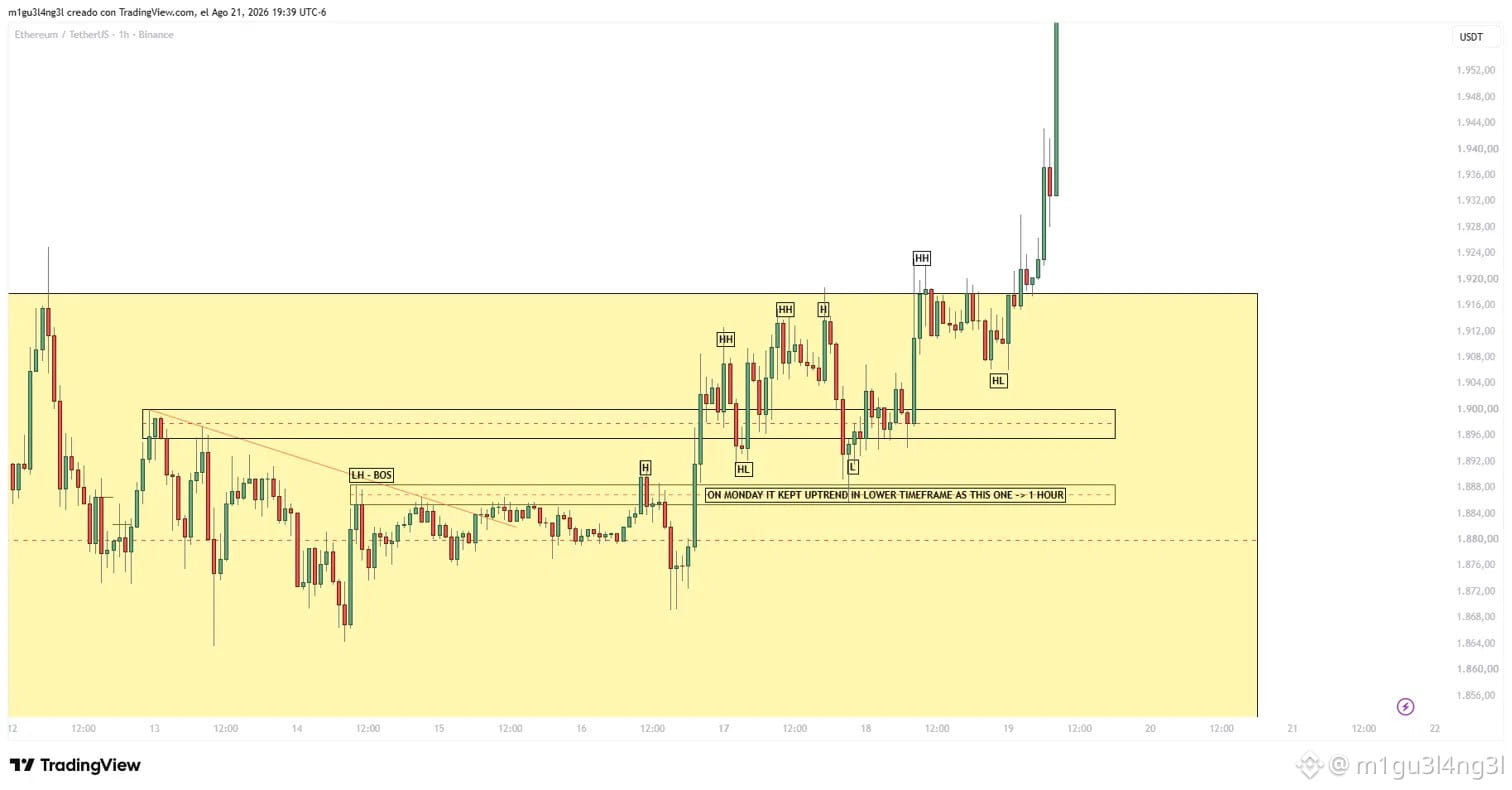
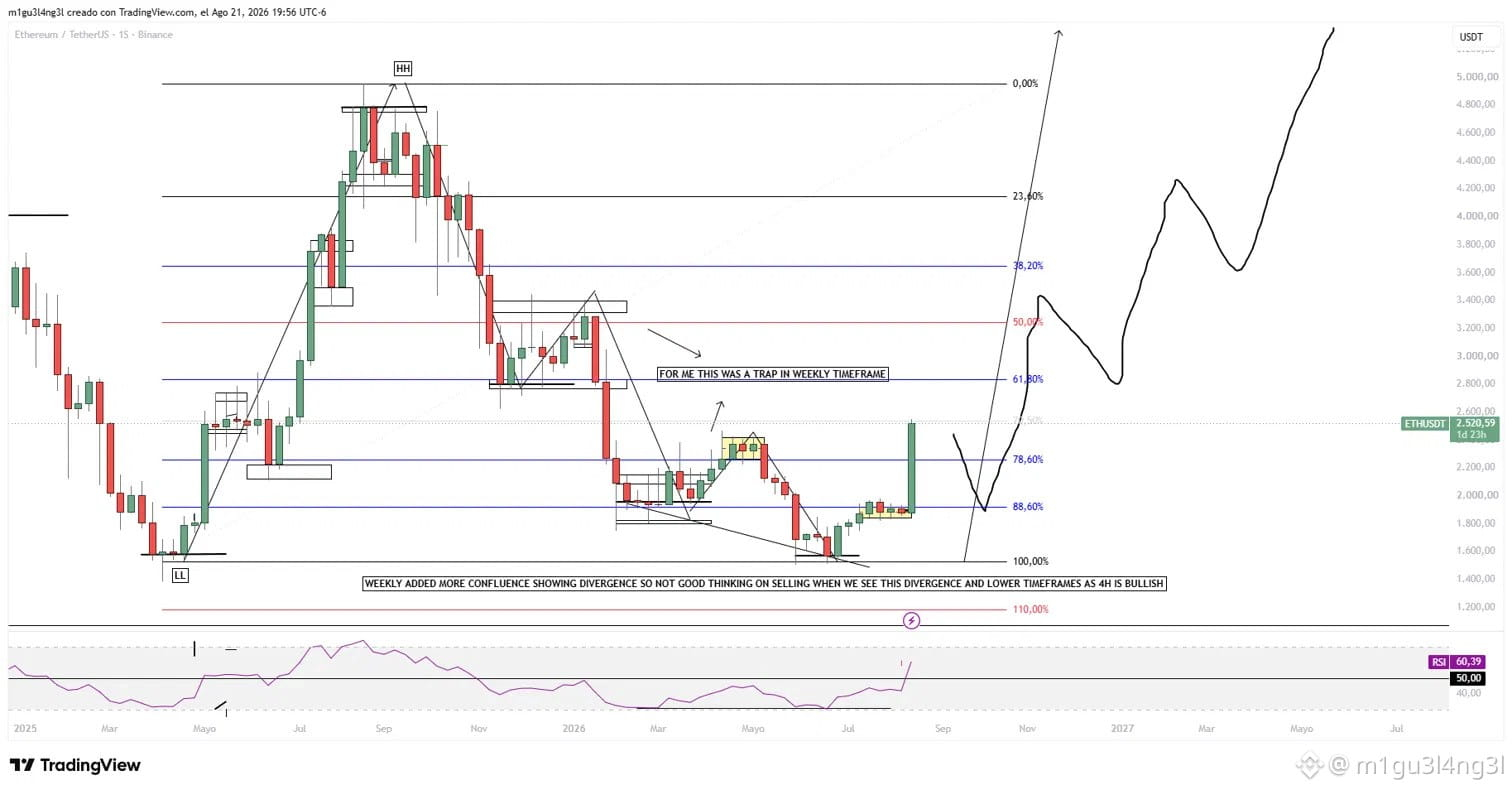
Quick trade less than 5 minutes hahah I want to wait more confirmation before entering in short positions 🎉🥃 #Eth
Done for today. Probably it will pump but well lets wait another entry ! 🤷🏻♂️ not too much but honest work!
Waiting ⌛️
m1gu3l4ng3l
·
--
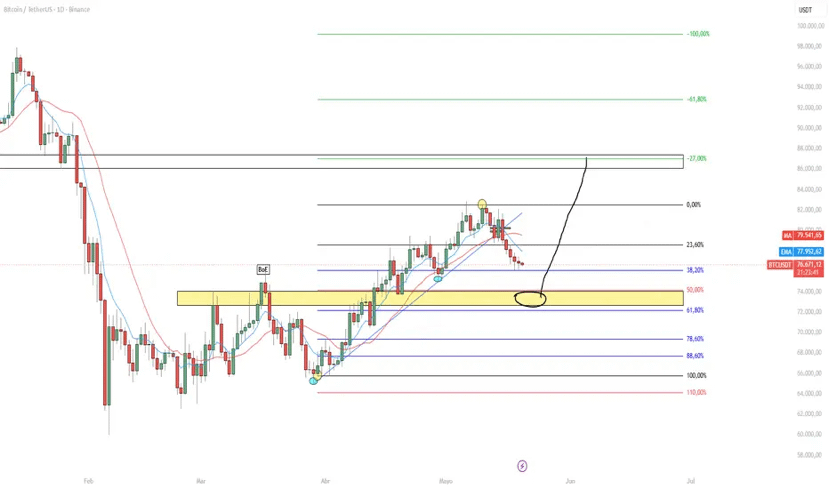
BTC — Liquidity at 74K Before the Next Rally?
BTC is approaching a critical demand zone on the daily timeframe again. The short-term bullish structure remains intact as long as the price respects the marked block between 73k–74k, which previously acted as resistance and can now serve as support after the breakout.
Currently, we see:
Loss of momentum after the rejection in the 82k zone. EMAs starting to cross bearish in the short term. Controlled pullback without strong structural breakdown yet. The main trend remains bullish as long as it doesn't lose relevant lows.
Probable scenario:
If BTC cleans liquidity in the yellow zone and aggressive buying comes in, it could initiate a new expansion towards the upper imbalance around 86k–88k. That area remains the macro target as long as support holds.
Key zone:
Strong support: 73k–74k
Structural invalidation: solid daily close below 72k.
Bullish targets: 80k → 84k → 86k–88k
What's important now is to observe price reaction at demand:
Candlesticks with strong rejection
Quick recovery of EMA 18
Buyer volume entering support
As long as there’s no confirmed breakdown, this seems more like a correction within a bullish trend than a complete structural change.$BTC
BTC is approaching a critical demand zone on the daily timeframe again. The short-term bullish structure remains intact as long as the price respects the marked block between 73k–74k, which previously acted as resistance and can now serve as support after the breakout.
Currently, we see:
Loss of momentum after the rejection in the 82k zone. EMAs starting to cross bearish in the short term. Controlled pullback without strong structural breakdown yet. The main trend remains bullish as long as it doesn't lose relevant lows.
Probable scenario:
If BTC cleans liquidity in the yellow zone and aggressive buying comes in, it could initiate a new expansion towards the upper imbalance around 86k–88k. That area remains the macro target as long as support holds.
Key zone:
Strong support: 73k–74k
Structural invalidation: solid daily close below 72k.
Bullish targets: 80k → 84k → 86k–88k
What's important now is to observe price reaction at demand:
Candlesticks with strong rejection
Quick recovery of EMA 18
Buyer volume entering support
As long as there’s no confirmed breakdown, this seems more like a correction within a bullish trend than a complete structural change.$BTC
BTC — Liquidity at 74K Before the Next Rally?
BTC is approaching a critical demand zone on the daily timeframe again. The short-term bullish structure remains intact as long as the price respects the marked block between 73k–74k, which previously acted as resistance and can now serve as support after the breakout.
Currently, we see:
Loss of momentum after the rejection in the 82k zone. EMAs starting to cross bearish in the short term. Controlled pullback without strong structural breakdown yet. The main trend remains bullish as long as it doesn't lose relevant lows.
Probable scenario:
If BTC cleans liquidity in the yellow zone and aggressive buying comes in, it could initiate a new expansion towards the upper imbalance around 86k–88k. That area remains the macro target as long as support holds.
Key zone:
Strong support: 73k–74k
Structural invalidation: solid daily close below 72k.
Bullish targets: 80k → 84k → 86k–88k
What's important now is to observe price reaction at demand:
Candlesticks with strong rejection
Quick recovery of EMA 18
Buyer volume entering support
As long as there’s no confirmed breakdown, this seems more like a correction within a bullish trend than a complete structural change.$BTC
BTC is approaching a critical demand zone on the daily timeframe again. The short-term bullish structure remains intact as long as the price respects the marked block between 73k–74k, which previously acted as resistance and can now serve as support after the breakout.
Currently, we see:
Loss of momentum after the rejection in the 82k zone. EMAs starting to cross bearish in the short term. Controlled pullback without strong structural breakdown yet. The main trend remains bullish as long as it doesn't lose relevant lows.
Probable scenario:
If BTC cleans liquidity in the yellow zone and aggressive buying comes in, it could initiate a new expansion towards the upper imbalance around 86k–88k. That area remains the macro target as long as support holds.
Key zone:
Strong support: 73k–74k
Structural invalidation: solid daily close below 72k.
Bullish targets: 80k → 84k → 86k–88k
What's important now is to observe price reaction at demand:
Candlesticks with strong rejection
Quick recovery of EMA 18
Buyer volume entering support
As long as there’s no confirmed breakdown, this seems more like a correction within a bullish trend than a complete structural change.$BTC
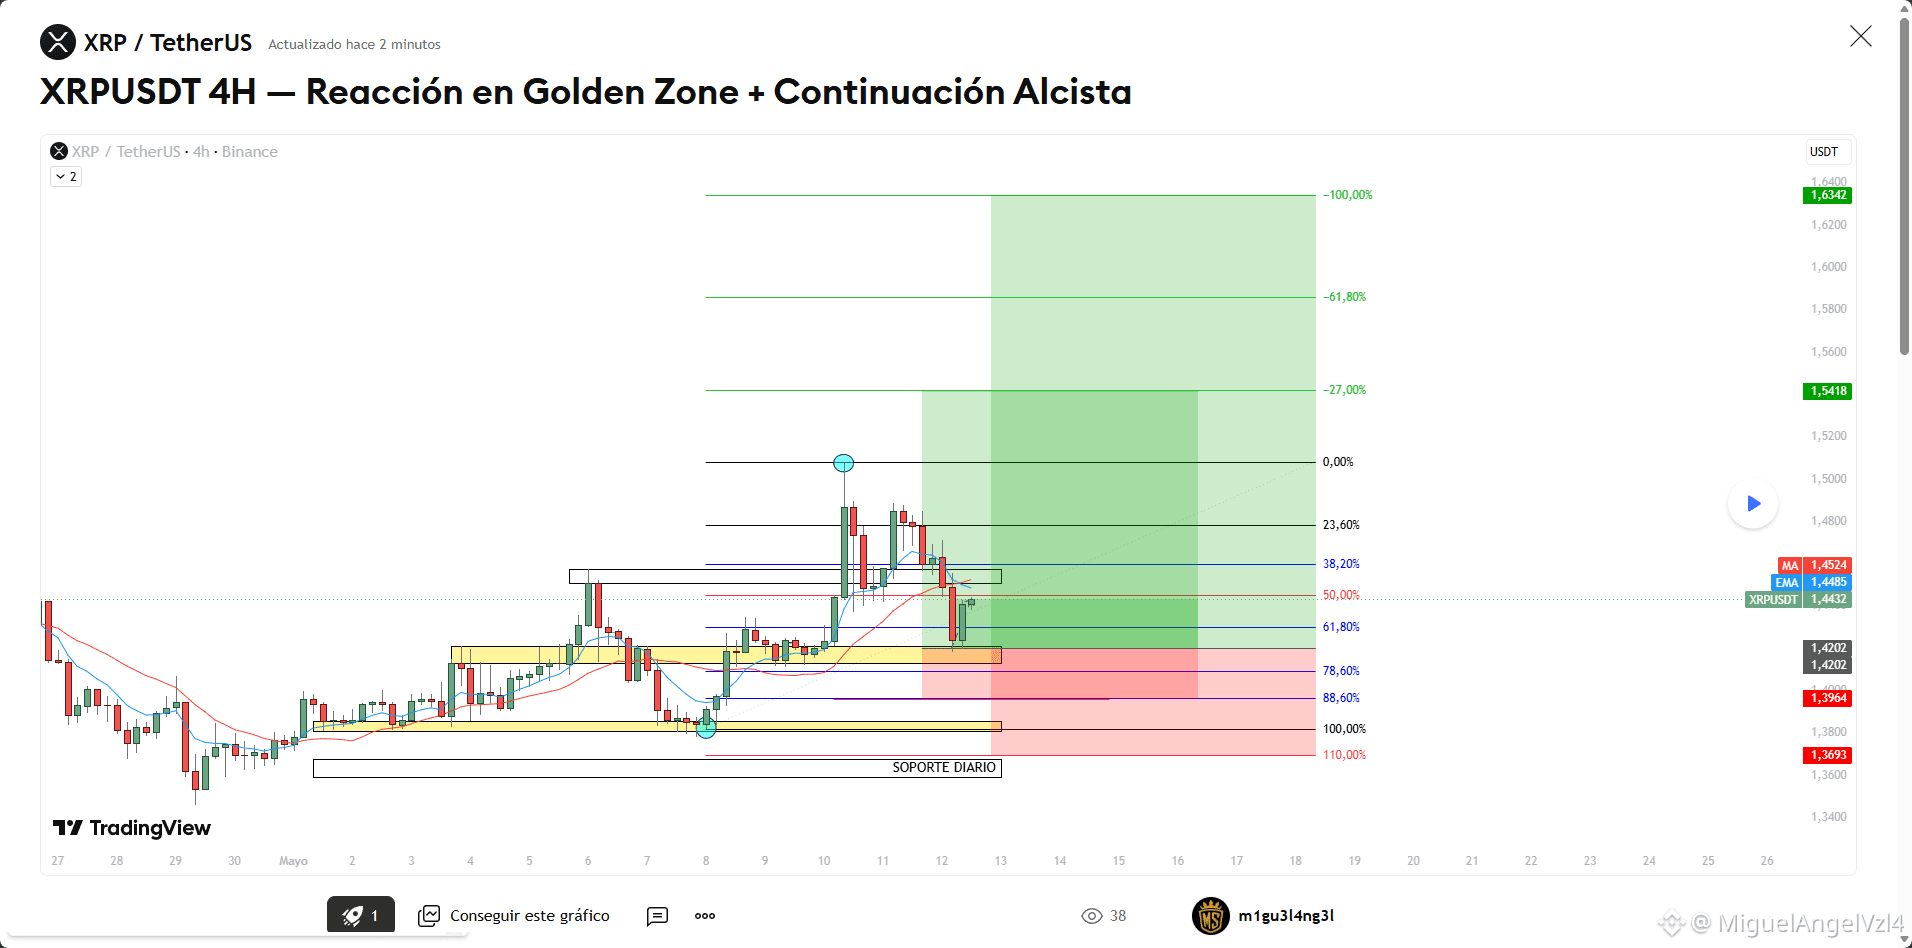
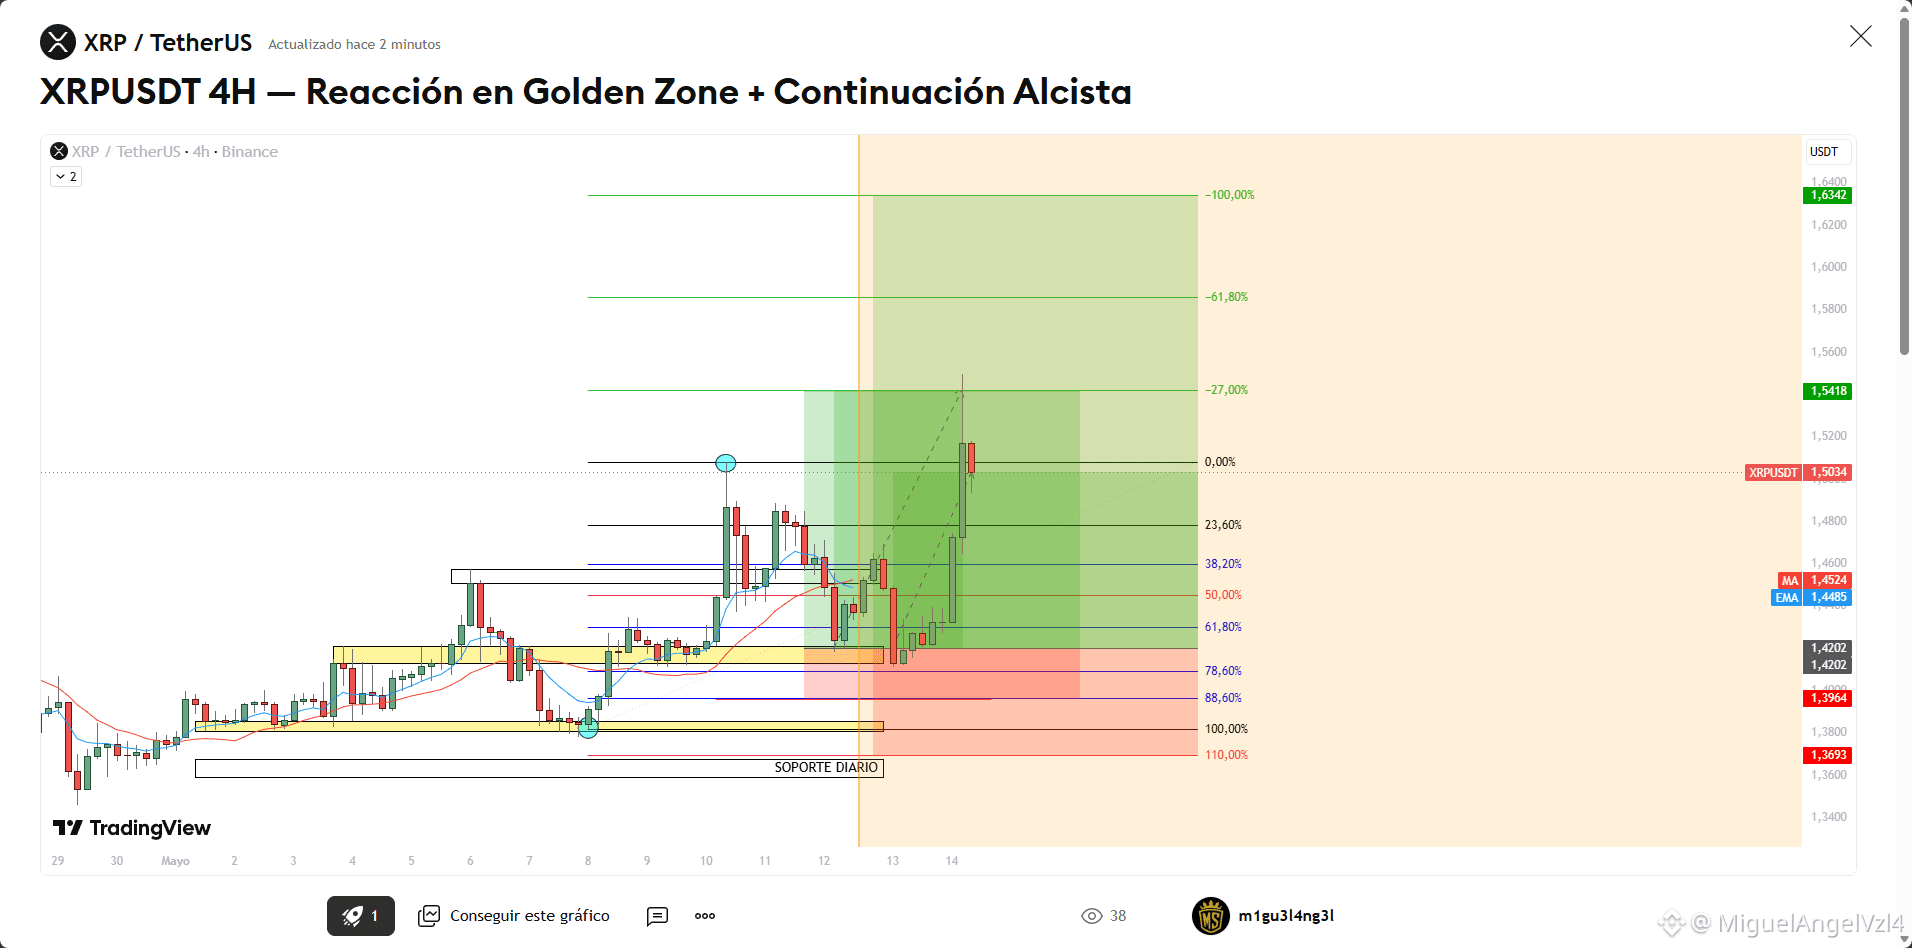
Ripple trade completed! Futures executed / Spot trades still pending for my holdings... https://es.tradingview.com/chart/XRPUSDT/btmt1Z9f/ 🎉 #Xrp🔥🔥 #futurestraders $XRP
Its time to give opportunity to coins that were sleeping as > $RIVER . I would like to see this coin around 16.79 / 20.32 / 30$ 🔥
On the way ! 💎
Quoted content has been removed
Log in to explore more content