Hello everyone! 👋
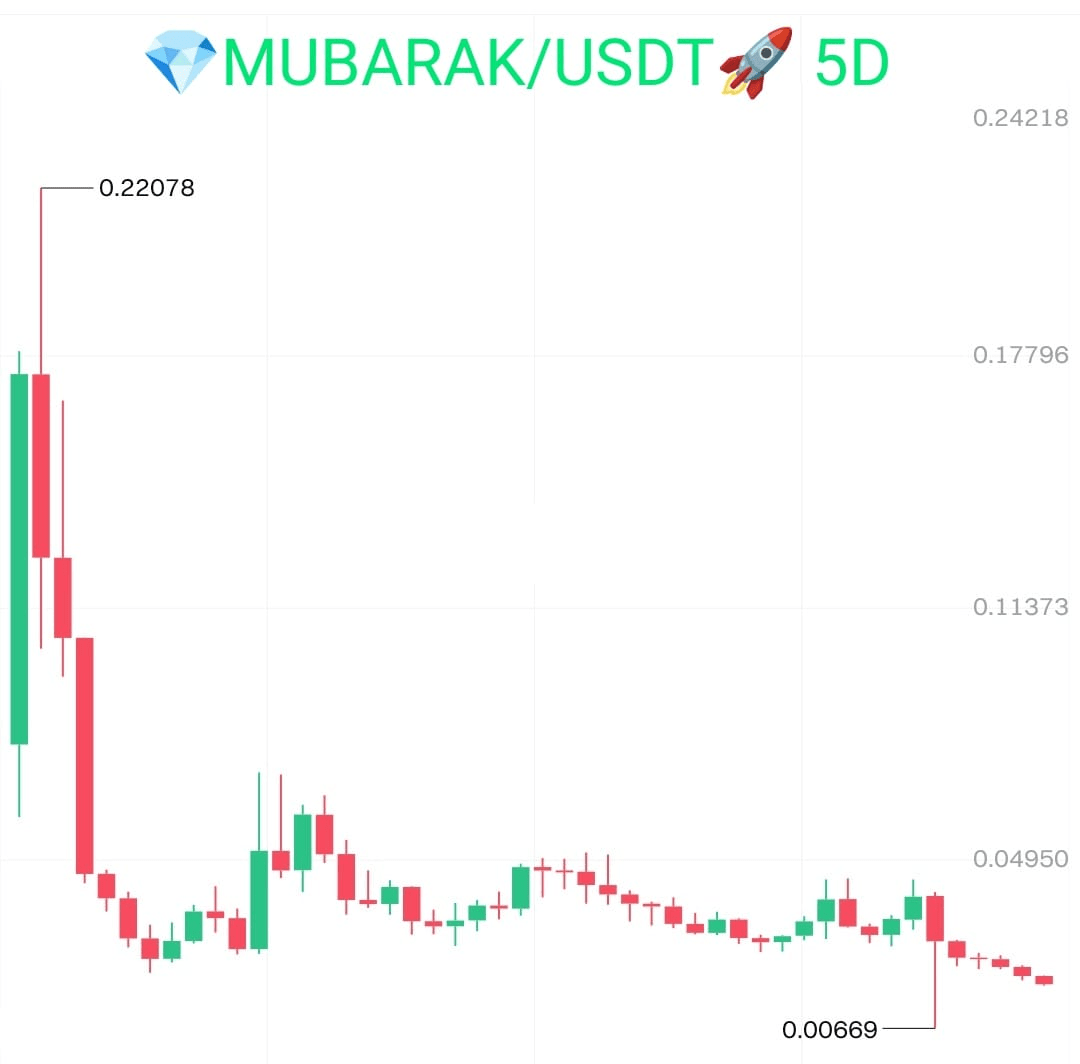
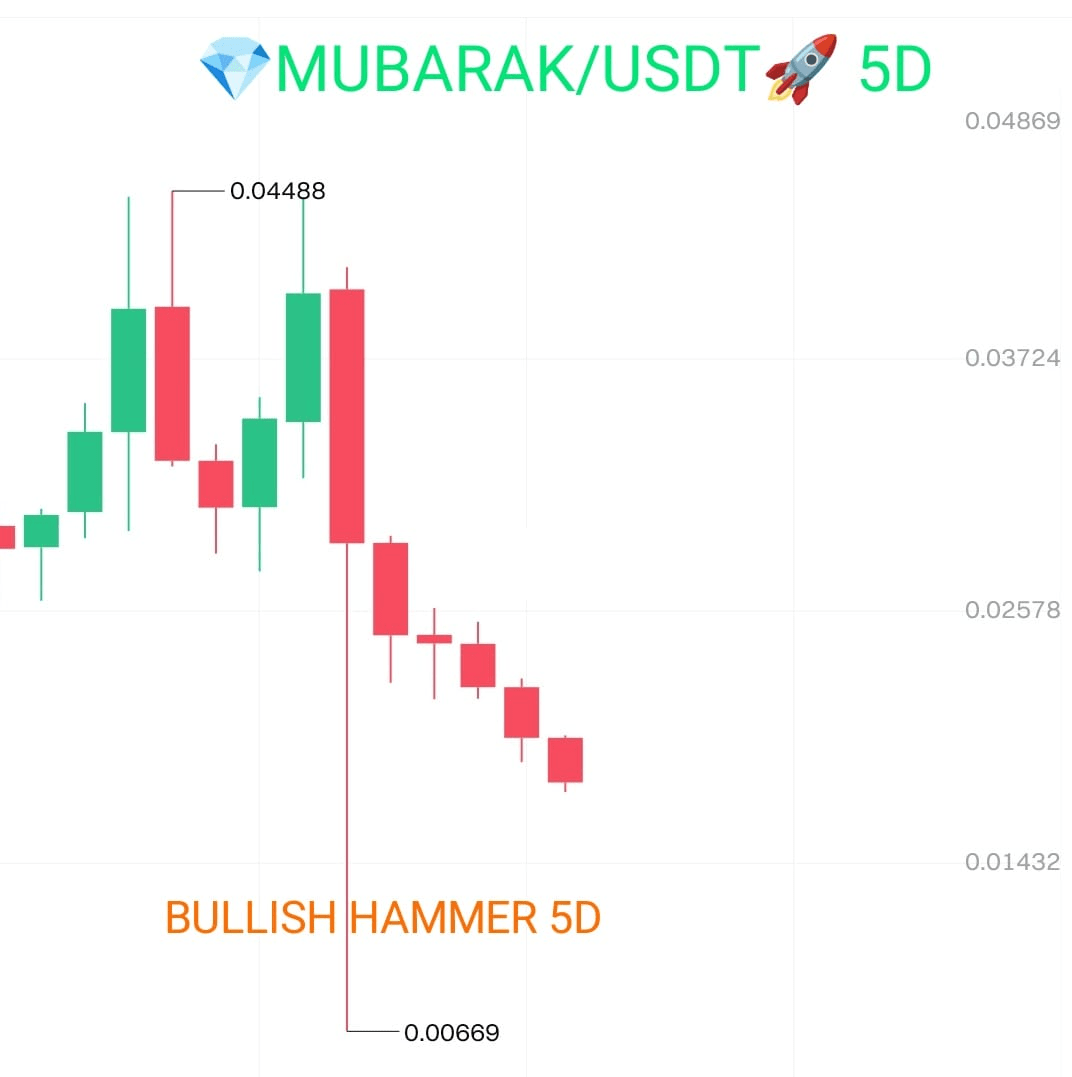
On the MUBARAK Token Price Chart, at the very bottom of the Downtrend, in an oversold market, on the Five-Day Timeframe 5D, from October 9 to 13 (inclusive), a 'Bullish Hammer' pattern was formed, an ideally proportional structure, Red in Color, which is currently testing the price strengthening stage below the level of $0.02. The actual lower shadow of the candle is even longer than in the picture, as on the Major Trading Platforms the price minimum dropped below the level of $0.004.
The above-mentioned Red Pattern is usually weaker than the Green one, but not always.
We are waiting for an increase in Trading volumes, as well as other additional positive signals to confirm this Candle Model.
I assume that if there are no new Treacherous Statements in the coming days that could break the hopes for the recovery of the value of BTC, ETH, and SOL coins, then this time the Blessed Digital Diamond Project 💎MUBARAK💎 must show the Trading Community what it is capable of. But for this, the Creators and Promoters of the Project must also make maximum efforts and at the right moment boost the Token's value to attract new Retail and Large Buyers. If this is not done at the right moment, unfortunately, this Project may gradually fade into oblivion without showing its real potential, as happened with many other Projects whose Popularity lasted only a short time.
Conduct your own DYOR and try to take your profitable positions in advance 🟢
They can be not only very profitable but also crucial in your Crypto Portfolio 🌟💫✨💰💰💰
Never forget to set TP and SL.
*Asset safety rating: 79.01 ✅