

📉 $SUI Short Analysis (Candlestick View)
🔎 Market Structure (Short Bias)
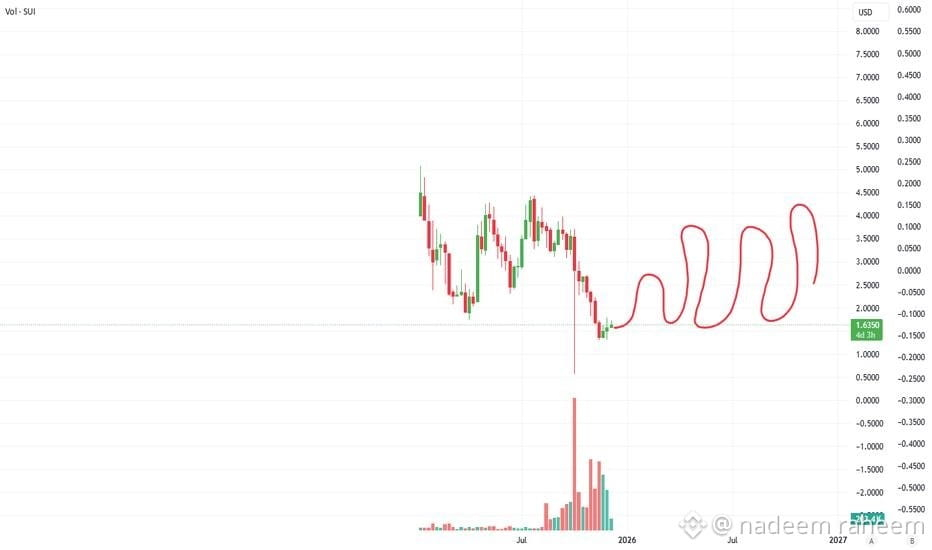
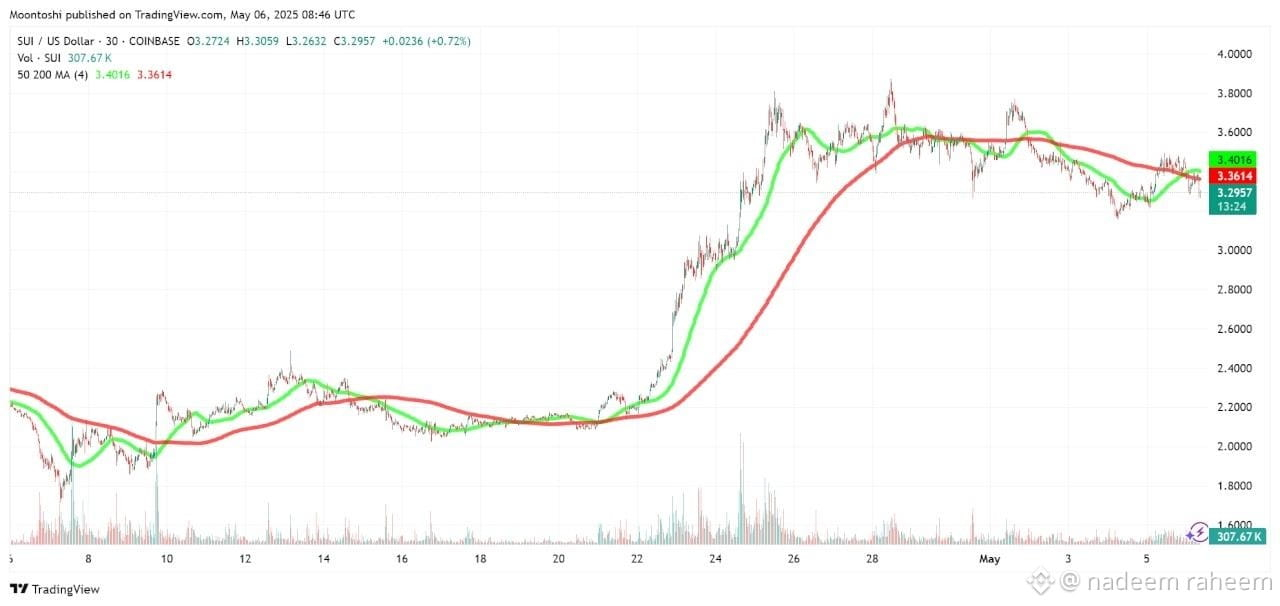
Right now, $SUI is showing weak bullish continuation with strong resistance overhead. The candlestick structure suggests:
Repeated lower highs → bearish pressure
Weak bounce from support (not impulsive)
Volume spikes mostly on sell-offs, not rallies
🕯️ Candlestick Signals
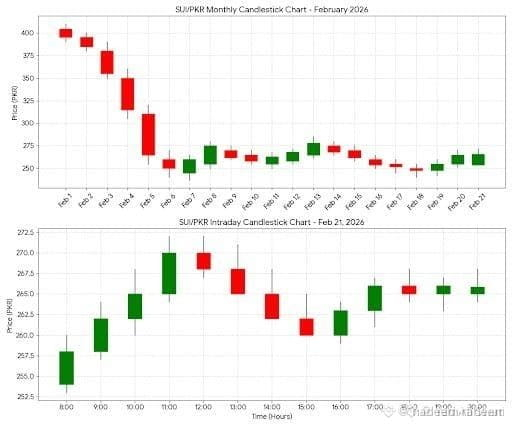
Recent patterns (multi-timeframe) show mixed but slightly bearish signals:
Doji + Shooting Star → indecision near resistance
Bearish engulfing patterns → rejection zones
Occasional bullish engulfing → short-term relief only (Investing.com)
👉 Translation: Market is choppy, but sellers still control trend direction
📊 Key Levels
Resistance: $1.95 – $2.20
Major Resistance: $2.80+
Support: $0.90 – $1.00
Breakdown zone: below $0.85 → strong short continuation (CoinCodex)
📉 Short Trade Idea (Simple)
Entry: Near resistance (1.9–2.1 zone)
Stop Loss: Above 2.3
Targets:
TP1 → $1.30
TP2 → $1.00
TP3 → $0.85
⚠️ Overall Bias
Trend: Bearish / Sideways
Momentum: Weak (RSI near neutral ~33) (CoinCodex)
Market sentiment: More bearish than bullish
🧠 Final Take
This isn’t a clean trend — it’s a range with downside risk. Shorts make sense only near resistance, not in the middle.
#ArthurHayes’LatestSpeech #EthereumFoundationUnstakes$48.9MillionWorthofETH #TetherFreezes$344MUSDTatUSLawEnforcementRequest $