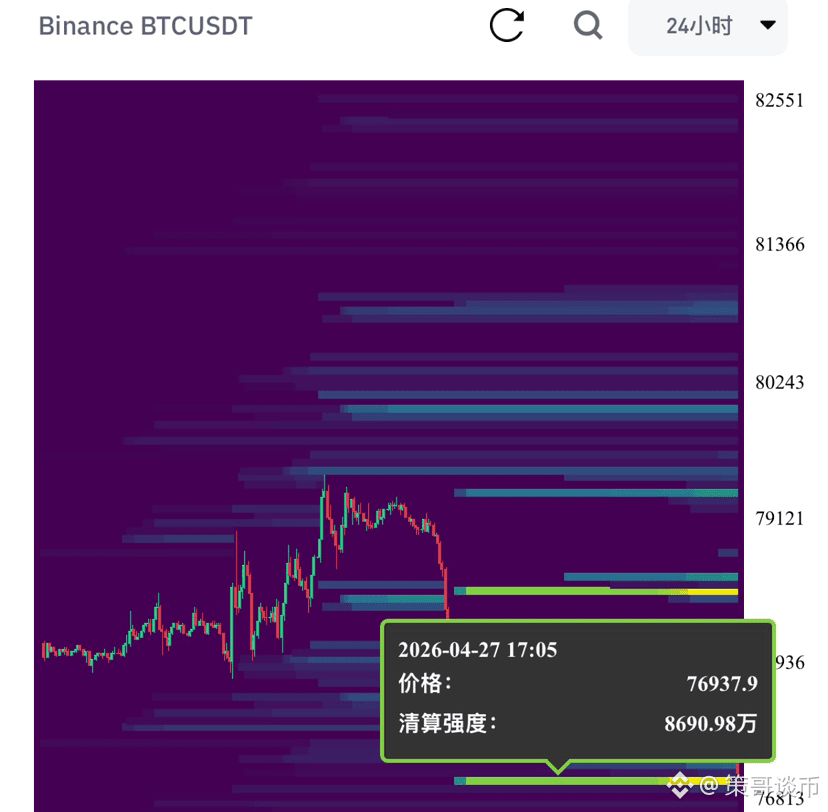
🔥 Bitcoin is hitting resistance at 80k and is pulling back, with daily candlesticks showing a long upper shadow indicating a potential top and shakeout. Bullish momentum is fading, and profit-takers are exiting! The overall trend remains intact, with only high-level consolidation and not a trend reversal!
Key resistance levels (must hold for a bounce)
Short-term weak resistance: 77800
Intermediate strong resistance: 78500 (core area of double top pressure)
Ultimate heavy resistance: 79200-80000 (heavy sell pressure, hard to break through in one go)
Hardcore support levels (for downward catching)
Short-term first support: 76500
Core trend support: 75500
Mid-term bullish lifeline: 74000
Future market projections
1. High probability: After a pullback to support, we might see a sideways consolidation with low volume, repairing indicators for another attack on resistance.
2. Shakeout movement: A quick spike testing 74000 followed by a rapid recovery, forming a long lower shadow to build strength.
⚠ Risk control red line: If the 4-hour candlestick closes below 74000, reassess bullish strategies, as any further drop could be a trap!
Practical trading rhythm
If resistance isn't broken on the bounce, don't chase the highs; take profits in batches at high levels. Buy the dip in the support zone and reduce leverage to avoid getting caught in shakeouts!
Focus on naked candlestick analysis, with clear levels and no second-guessing! I'm the king of this square, providing daily real-time market analysis, so like and follow to stay in sync with the main players, and don't get left behind! 🔥
Key resistance levels (must hold for a bounce)
Short-term weak resistance: 77800
Intermediate strong resistance: 78500 (core area of double top pressure)
Ultimate heavy resistance: 79200-80000 (heavy sell pressure, hard to break through in one go)
Hardcore support levels (for downward catching)
Short-term first support: 76500
Core trend support: 75500
Mid-term bullish lifeline: 74000
Future market projections
1. High probability: After a pullback to support, we might see a sideways consolidation with low volume, repairing indicators for another attack on resistance.
2. Shakeout movement: A quick spike testing 74000 followed by a rapid recovery, forming a long lower shadow to build strength.
⚠ Risk control red line: If the 4-hour candlestick closes below 74000, reassess bullish strategies, as any further drop could be a trap!
Practical trading rhythm
If resistance isn't broken on the bounce, don't chase the highs; take profits in batches at high levels. Buy the dip in the support zone and reduce leverage to avoid getting caught in shakeouts!
Focus on naked candlestick analysis, with clear levels and no second-guessing! I'm the king of this square, providing daily real-time market analysis, so like and follow to stay in sync with the main players, and don't get left behind! 🔥