

1. Bitcoin liquidity intelligence: Core weight and imbalance in-depth analysis
01 Macro evolution of price behavior and technical structure
Bitcoin (BTC) trading performance on April 27, 2026, marks the asset entering a new valuation phase dominated by institutional capital. As of the morning of that day, Bitcoin's price fluctuated around $79,032, just a step away from the critical psychological and technical defense level of $80,000. Over a broader time span, Bitcoin underwent a painful deleveraging process after reaching a historical high of $126,000 in October 2025, dipping to the $60,000 range in February 2026. The current upward trajectory is seen as a decisive pivot from a long-term downtrend channel to a platform recovery.
Technical indicators show that Bitcoin is exhibiting significant bullish momentum on the daily level. The 50-day moving average continues to rise, indicating an extremely strong short-term trend, while the 200-day moving average has also entered a steady upward channel since April 23, 2026, establishing long-term structural support.
However, there remains certain bear market resistance within the weekly framework. Traders need to pay attention to the closing situation of the 21-week moving average (MA 21); based on historical cycle statistics, only after two consecutive weeks closing above this moving average will the cyclical downside risk triggered by the previous 2025 peak statistically be considered nullified.
02 Order book imbalance and liquidity heatmap
Through high-resolution analysis of the order books of major spot exchanges (especially Binance and Coinbase), the real distribution characteristics of current market liquidity can be observed. The heatmap shows an extremely dense sell-side liquidity wall in the $80,000 to $82,000 range. According to the data, Bitcoin's sell orders (Asks) have reached $1.57 billion within a 5% range above the current price, while buy orders (Bids) stand at only $1.125 billion. This approximately 40% supply surplus constitutes a heavy suppression layer, indicating that without extreme bullish catalysts, the price will face frequent profit-taking pressure when challenging the $80,000 mark.
Conversely, the buying liquidity 'magnet zone' is primarily concentrated at levels of $71,000, $72,000, and $73,000. The Depth Delta indicator shows that while there is immense pressure above, the support barrier at the bottom is strengthening. This 'top-heavy' liquidity structure suggests that the market may need a sharp washout or prolonged sideways consolidation to absorb the selling pressure above.

03 The decisive impact of spot ETF capital flows
In April 2026, the capital inflow of the US spot Bitcoin ETF has become the core engine driving prices. After experiencing a four-month net outflow from November 2025 to February 2026, institutional funds began to return strongly in March. In the week ending April 24, the US spot Bitcoin ETF recorded a net inflow of $996.4 million, with BlackRock's IBIT fund being particularly notable, absorbing $732.6 million in a single week, accounting for nearly 89% of the total inflow.
The strength of this institutional buying pressure has caused a severe distortion in the micro supply-demand balance. During the eight trading days in late April, institutions purchased approximately 19,000 BTC through ETF channels, which is nine times the amount of BTC newly mined in the same period (about 2,111 BTC). This significant scarcity pressure is the main reason Bitcoin has been able to approach $80,000 while ignoring macro uncertainties. The current total assets of spot ETFs have exceeded $101 billion, accounting for about 6.57% of Bitcoin's circulating market cap, marking Bitcoin's transition from a retail-driven speculative asset to a core member of institutional asset allocation pools.
04 Macroeconomic event background: The Fed and geopolitical factors
The market trend for this week (starting April 27) will be heavily influenced by the Federal Open Market Committee (FOMC) meeting on April 28-29. Although the market widely expects the Fed to maintain interest rates unchanged, Fed Chair Powell's policy statement regarding the inflation baseline will be crucial. Analysts point out that if Powell emphasizes that tariff-driven inflation pressures remain solid, even if geopolitical tensions ease, the narrative of 'higher for longer' interest rates could exert short-term pressure on risk assets like cryptocurrencies.
Additionally, the indefinite extension of the ceasefire agreement regarding the Hormuz Strait on April 22 has greatly alleviated the risk premium previously triggered by the escalation of the Middle East situation. This not only stabilized global oil prices but also caused the cryptocurrency market's fear and greed index to rebound from the extreme fear zone below 25 to a neutral level of 48, creating external conditions for the return of risk appetite.
05 Prediction for the next 24 hours: Intense battle at the $80,000 mark
In summary of the above data, analysts believe Bitcoin will experience extremely high volatility in the coming 24 hours.
Bullish target: The primary goal is to close above $79,500 and attempt to break through $80,519 to confirm the validity of the short-term upward channel.
Bearish target: If the price faces resistance at $80,000, bears will attempt to push the price back to the $77,754 to $78,000 range to test the buying strength below.
Trend analysis: Bitcoin is expected to consolidate within a narrow range between $78,500 and $79,800. Considering the potential buying pressure from ETF injections after the US stock market opens, a slight spike testing $80,000 is likely, but in the absence of macro bullish catalysts, a pullback is anticipated, ultimately closing above $79,000.
2. Ethereum intelligence: Beta attributes and correlation divergence
01 Ethereum technical candlestick analysis and correlation
Ethereum (ETH) showed a high degree of synchronicity with Bitcoin's performance on April 27, 2026, with a correlation coefficient remaining above $0.85$. ETH's price that day was approximately $2,380.46, up 2.68% in the last 24 hours. Nevertheless, from a deeper technical structure perspective, Ethereum is facing more severe resistance than Bitcoin.
Currently, Ethereum is trading in a sideways range between $2,317 and $2,404. While the price is above the 20-day exponential moving average (EMA20, around $2,300.57), indicating a short-term bullish bias, the Supertrend indicator still emits a sell signal, and the MACD histogram shows negative values, suggesting that upward pressure is not entirely alleviated. Ethereum's performance in 2026 has consistently lagged behind Bitcoin, with Bitcoin down about 19% year-to-date as of mid-April, while Ethereum has dropped as much as 27%.
02 Consistency of trends and sources of divergence
The reason Ethereum appears to be lagging in the rebound is primarily due to the following three structural issues:
Bitcoin dominance: Currently, Bitcoin accounts for 57% of the entire crypto market, with institutional funds prioritizing entry through ETFs, leading to Ethereum's market share dropping to around 10%.
Fee capture compression: With the maturation of Layer 2 ecosystems (such as Arbitrum, Base, etc.), Ethereum Layer 1's fee destruction mechanism (EIP-1559) has been somewhat suppressed, weakening Ethereum's deflation narrative in the short term.
High Beta volatility: Ethereum's beta coefficient compared to Bitcoin is relatively high, meaning it tends to drop deeper during market panic. However, in the early stages of recovery, capital flows often prioritize Bitcoin, which has 'safe-haven' attributes, leading to delays in Ethereum's recovery pace.
03 Next 24-hour analysis
Based on current candlestick patterns, Ethereum's performance in the next day will depend on attempts to break through the key resistance level of $2,425.
Bullish scenario: If Bitcoin holds above $80,000, Ethereum is likely to break through the swing high of $2,425, confirming a higher high structure and aiming for the Supertrend resistance level at $2,647.
Bearish scenario: If the price drops below the recent swing low of $2,368, it will confirm the formation of a lower high, and the price may swiftly slide toward the key support level of $2,094.
Conclusion: In the next 24 hours, Ethereum is more likely to maintain sideways consolidation. Expected price movements will be narrow within the range of $2,350 to $2,410 until Bitcoin clarifies its breakout direction at $80,000.
3. Three altcoin trading strategies: TAO, NEAR, HYPE
01 Bittensor (TAO): The infrastructure game of decentralized AI
As a leading decentralized machine learning protocol, Bittensor (TAO) is at a highly risk-reward crossroad in April 2026. TAO's price is currently fluctuating around $250, showing a significant pullback from its historical high of $757.60.
Strategy configuration suggestions:
Entry range: $240 - $250. This range is above the recent support point, and daily trading volume shows significant signs of chip rotation (Volume/Market Cap ratio as high as 58.6%).
Take profit target: Short-term target set at $271 (to repair the downside gap), mid-term targets at $330 and $450.
Stop-loss limit: $218. Breaching this level means a complete collapse of market confidence in its AI subsidy model.
Liquidity setup: Given that about 70% of TAO's circulation is locked in staking, its actual market depth is relatively shallow. Large traders should utilize decentralized limit orders to avoid exceeding 2% slippage in liquidity pools like Uni V3.
In-depth analysis and real insights: Analysts believe that the current downside risk of TAO has largely been hedged by the halving event in December 2025 (daily output dropping from 7,200 to 3,600). Although there are doubts about whether its subnet can generate real external income, NVIDIA's $420 million injection in Q1 and BitGo's provision of institutional-grade custody services keep it in a monopolistic position in the AI+Web3 narrative.
02 Near Protocol (NEAR): Chain abstraction and whale accumulation narrative
Near Protocol (NEAR) has shown strong fundamental resilience in 2026. Despite facing a $600,000 indirect risk exposure due to Litecoin network vulnerabilities, its narrative of 'chain abstraction' and 'universal add-on' is attracting significant capital inflows.
Strategy configuration suggestions:
Entry range: $1.33 - $1.41. This range coincides with the convergence of the 20-day, 50-day, and 100-day moving averages (EMA), providing strong structural support.
Take profit target: The primary resistance level is at $1.50, and if broken, we look towards $1.66 (200-day EMA).
Stop-loss limit: $1.20. If this psychological support level is breached, it signifies a failure of the recent bottoming logic.
Liquidity setup: It is recommended to set concentrated liquidity in the DeFi protocol within a range of $1.20 to $1.80 to capture recent corrective volatility gains.
In-depth analysis and real insights: The biggest highlight for NEAR currently lies in its chip concentration. On-chain data shows that the accumulation ratio of whale addresses has reached 63%, which is usually a precursor to the market entering an exponential explosion phase. Additionally, its annual inflation rate has dropped from 5% to 2.5% due to governance decisions, significantly improving its long-term supply dynamics. Analysts maintain a 'cautiously bullish' stance on NEAR, believing its valuation recovery has only just begun.
03 Hyperliquid (HYPE): The yield king of perpetual DEX
Hyperliquid (HYPE) is the most talked-about token of 2026. Benefiting from its buyback mechanism (97% of protocol revenue used to burn tokens), HYPE is turning trading volume into tangible token deflationary pressure.
Strategy configuration suggestions:
Entry range: $38 - $41. As a currently strong upward trending token, any pullback to the $40 mark is viewed as an entry opportunity.
Take profit target: Short-term bullish to $45, mid-term bullish to $50, and long-term predictions (from Arthur Hayes’ perspective) even reaching $150.
Stop-loss limit: $36. This level is the key jumping-off point for this round of upward movement.
Liquidity setup: Due to HYPE's high reflexivity, it is recommended to maintain a low leverage ratio in liquidity pools or participate in its token deflationary dividends through spot holdings.
In-depth analysis and real insights: Analysts believe that HYPE is not just a simple DEX token; it's actually an on-chain liquidity layer. Its HIP-3 and HIP-4 upgrades will allow for permissionless prediction markets and real-world asset (RWA) peg, providing an income base that goes beyond crypto volatility. Arthur Hayes' characterization as the 'only buy object' has significantly boosted its market valuation premium.
4. Real movements of whales and smart money
01 Storage and movement of institutional funds
On-chain data from April 2026 reveals a clear pattern: retail investors are selling in price consolidations, while institutions and 'smart money' are covertly accumulating through liquidity. Arkham Intelligence data tags show that BlackRock and Coinbase Custody addresses saw small-scale BTC inflows on April 27, while overall BTC reserves on exchanges have dropped to 2.671 million, a new low in years.
This phenomenon of 'exchange inventory depletion' often accompanies structural price surges. When available supply (Liquid Supply) is withdrawn to cold storage, even minor buying demand can trigger significant price movements.
02 Smart money industry preference comparison
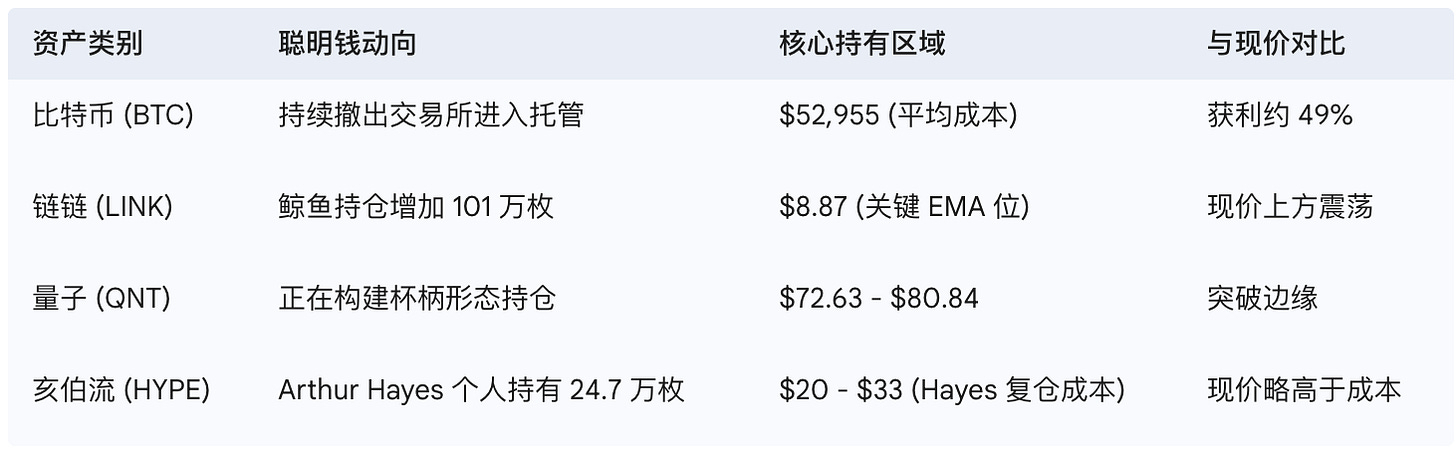
In terms of Ethereum, despite the weak price, on-chain analysis shows that the locked value (TVL) of Layer 2 has not diminished. Instead, the funding activity on Arbitrum and Base is at historical peaks, indicating that while smart money is reducing ETH L1 holdings, it is increasing its exposure to the expansion of Ethereum's ecosystem.
5. On-chain overview: Medium to long-term analysis based on real institutional data
01 Long-term holders (LTH) vs. short-term holders (STH) showdown
The on-chain MVRV ratio currently remains below $2.0, which is statistically a very robust signal. $MVRV < 2.0$ means the market has not yet entered the so-called 'frenzy bubble zone', where institutional investors typically choose to hold rather than cash out.
Moreover, the supply of long-term holders (LTH) who have held for over 155 days remains at historical highs. This means that despite experiencing a crash in 2025 and a pullback in early 2026, Bitcoin's 'core holding group' has not been shaken out. Conversely, recently, 345,000 BTC have matured into the LTH category, reflecting the strengthening stability of the market's underlying structure.
02 Future trends in institutional data indicate
Analysis shows that the inverse correlation between Bitcoin and global monetary easing policies ($-0.778$) has completely changed the operational playbook for institutions. Previously, institutions bought Bitcoin to hedge against inflation, but now they view it more as a deterministic, legally protected 'technological capital'. With the increased probability of the US CLARITY Act passing (currently predicted by Polymarket at 65%), more non-crypto native traditional funds are expected to enter the market in the second half of 2026.
6. Comprehensive interpretation: Logical core and viewpoint variables
01 The deeper implications behind the data
April 27, 2026, is far from an ordinary day of consolidation in the market. It marks a complete shift in the cryptocurrency market from 'narrative-driven' to 'cash flow/utility-driven'. Bitcoin is now acting as a macro settlement asset independent of liquidity cycles (due to the existence of ETFs), while assets like HYPE and TAO are shifting their value anchors from 'air expectations' to 'protocol fees' and 'computational output'.
Currently, the most critical macro indicator is not CPI or non-farm payrolls, but the downward slope of Bitcoin exchange inventories and the daily net inflows of spot ETFs. As long as these two indicators hold steady, breaking through the $80,000 mark is just a matter of time.
02 Aspects most focused on by analysts
The quality of the battle at Bitcoin's $80,000 mark: If the breakout is completed through a short squeeze, it is likely a false breakout; if the breakout is accompanied by daily inflows exceeding $500 million into IBIT, then the $100,000 target will be reached in Q2.
Mean reversion of the ETH/BTC exchange rate: The current weakness of Ethereum is quite unusual. If the ETH/BTC exchange rate falls to around $0.03, it will trigger large-scale institutional arbitrage buying, potentially leading to a collective surge in the altcoin market.
Marginal effects of geopolitical factors: The stability of US-Iran relations is the only 'pressure valve' for the current uncertainty in oil prices. Any new developments regarding the Hormuz Strait will instantly tighten global liquidity.
03 What factors could change the judgment perspective
Technical failure: If Bitcoin breaks below the support level of $74,000 with volume in the next 48 hours, I will define the current rise as a 'dead cat bounce' and shift to bearish until $60,000.
Regulatory black swan: Although the legal environment is improving, sudden heavy regulatory strikes against decentralized exchanges (like Hyperliquid) could destroy the current DeFi growth narrative.
Unexpected interest rate hike by the Fed: Although the probability is very low, if Powell announces a restart of interest rate hikes to thoroughly curb stubborn inflation, all risk asset pricing models will face a rewrite.
Summary suggestions
Analysts are cautiously optimistic about the next 24 hours. Traders are advised to exercise restraint around $80,000, avoiding high leverage long positions, and instead focus on incremental accumulation opportunities for NEAR and HYPE during pullbacks. Structural buying in Bitcoin remains strong, but the market often requires a 'downward inducement' to clear out weak leverage before hitting key levels.
Mathematical model reference: Based on MVRV ratio:

If the current $MVRV = 1.8, when it rises to the historical frenzy average of 3.5, Bitcoin's theoretical target price will approach: 153,600 USD.
This means that, in the long run, the current $80,000 is merely a relay station in this round of institutional bull run.