


Lessons of blood and tears: The trading rules in the cryptocurrency world that retail investors should ignore, understanding them can save you 3 years of detours
Trading in the cryptocurrency world has never been a gamble based on 'feelings', but rather a battlefield governed by 'rules'.
Countless investors have proven with their hard-earned money that: Staying alive is essential to wait for opportunities; following the rules is necessary to make money.
The golden rules of cryptocurrency trading I've organized today, each one hides the secrets of survival and profit.

1. Position Management: Staying alive is more important than anything else
'Going all in, winning will get you a model, losing means working hard on a construction site' — This is the most fatal lie in the cryptocurrency world. I've seen too many people completely exit the market after going all in once, and too many people go bankrupt due to heavy positions. The core of position management is to always leave yourself an escape route.
Never be fully invested: The position of a single cryptocurrency should not exceed 30% of total funds, mainstream coins (Bitcoin, Ethereum) can be appropriately increased to 40%, while altcoins should never exceed 10%. In extreme market conditions, at least 30% of cash positions should be retained for bottom fishing or averaging down.
Gradual position building/Profit-taking: When buying, divide into 3-5 batches. For example, first buy 20% of the position, then add 20% if it drops 10%-15%, avoiding being stuck at a high position all at once; when selling, also exit in batches, gradually realizing profits during the upward process, without being greedy to 'sell at the peak.'
Use stop-loss to 'save your life': Every trade must set a stop-loss, with mainstream coins' stop-loss lines at 5%-8%, and altcoins at 10%-15%. Once the stop-loss is triggered, leave decisively; do not hold onto the fantasy of 'just wait a bit for a rebound'—there is no 'myth of not falling' in the crypto space.
2. Respect the market: Give up the obsession with 'predicting market trends.'
A saying in the crypto space goes: 'You will never earn money beyond your understanding, and you will never escape the lessons of the market.' Too many people attempt to accurately determine price movements through candlesticks, news, or 'expert predictions,' only to end up being repeatedly cut in the process of chasing highs and lows. The market is always right; the only wrong judgment is yours.
Do not guess tops and bottoms: When Bitcoin rises from $10,000 to $60,000, countless people shout 'top'; when it falls from $60,000 to $15,000, some shout 'zero'. The facts prove that no one can accurately predict tops and bottoms; rather than getting caught up in 'bottom fishing', it is better to wait for 'trend confirmation.'
Go with the trend: In an upward trend, only go long and do not short; in a downward trend, only observe or lightly short; during sideways fluctuations, reduce operational frequency. The power of the trend far exceeds individual judgment; following the market is 10 times safer than acting against it.
Stay away from 'news trading': In the crypto space, the authenticity of news is hard to discern. 'Elon Musk's signal', 'institutional entry', 'favorable policies' are often bait for big players to offload their assets. By the time the news is confirmed, the market has already moved on—true good news turns into bad news, and true bad news turns into good news; this is an unchanging rule in the crypto space.
3. Mindset control: Don't let emotions dictate your trading.
The crypto space is a 'magnifying glass for human nature': Greed makes you reluctant to take profits, fear makes you afraid to bottom fish, luck makes you hold onto positions without stop-loss, and regret makes you eager to recover losses. Ultimately, 80% of losses are not due to lack of skills, but because of mindset collapse. The essence of trading is to fight against one's own human nature.
Do not chase highs and sell lows: Jumping in when a cryptocurrency surges and panicking to cut losses during a crash is the most common mistake for beginners. Remember: 'Do not chase during surges, do not sell during crashes.' Rapid rises must have corrections, and rapid declines must have rebounds; take a calm 10 minutes before making a decision.
Accept 'small losses and small gains': No one can make a profit on every trade. Accepting occasional small losses can prevent the 'break-even mentality' from amplifying risks. At the same time, do not be greedy for 'full profits'; capturing a portion of profits in a trend is enough; securing profits is what truly matters.
Don't become addicted to watching the market: 24-hour trading is a characteristic of the crypto space, but also a trap. Frequently watching the market will make you affected by short-term fluctuations and make impulsive decisions. It’s recommended to set stop-loss and take-profit levels and only check the market 2-3 times a day (for example, at 9 AM, 3 PM, and 9 PM) to maintain a stable mindset.
4. Long-termism: Don't treat the crypto space as a 'casino.'
Many people enter the crypto space to 'get rich quickly,' but those who truly make money are often those who treat it as a 'long-term investment.' Bitcoin has increased by more than ten million times since its inception in 2009, but countless people have exited due to short-term fluctuations, missing out on wealth opportunities. The crypto space is not a casino, but a marathon that requires patience.
Invest with 'idle money': Never use 'living expenses', 'mortgage money', or 'pension money' to trade cryptocurrencies. If these funds are lost, it will directly affect your life and force you to make irrational decisions. Only 'idle money that you won't feel distressed about losing' can help you maintain a calm mindset.
Long-term holding of core assets: For core assets like Bitcoin and Ethereum, a 'regular investment' strategy can be adopted—investing a fixed amount each month while ignoring short-term fluctuations, holding for at least 1-3 years. History has proven that the returns from long-term holding of core assets far exceed those from frequent trading.
Continuous learning: The pace of development in the crypto space is extremely fast, with new concepts like Web3, DeFi, NFT, Layer2 constantly emerging. Only by continuously learning and understanding the underlying logic of the industry can one judge which projects have long-term value and avoid being eliminated.
Some people say: 'In the crypto space, earning 10 times in a year is not difficult; what's difficult is earning 10% continuously for 10 years.' Money earned by luck will ultimately be lost due to lack of skill; only money earned through rules can truly stay in your pocket.
Today's rule is that I hope you not only 'read it', but also 'implement it'. When you learn to respect the market, control your positions, and manage your mindset, you will find that money in the crypto space is not that difficult to earn—the premise is that you first learn to 'stay alive.'
Finally, I want to share a saying with everyone: 'Slow is fast, stability is winning.' May you take fewer detours and earn real money on your path in the crypto world.
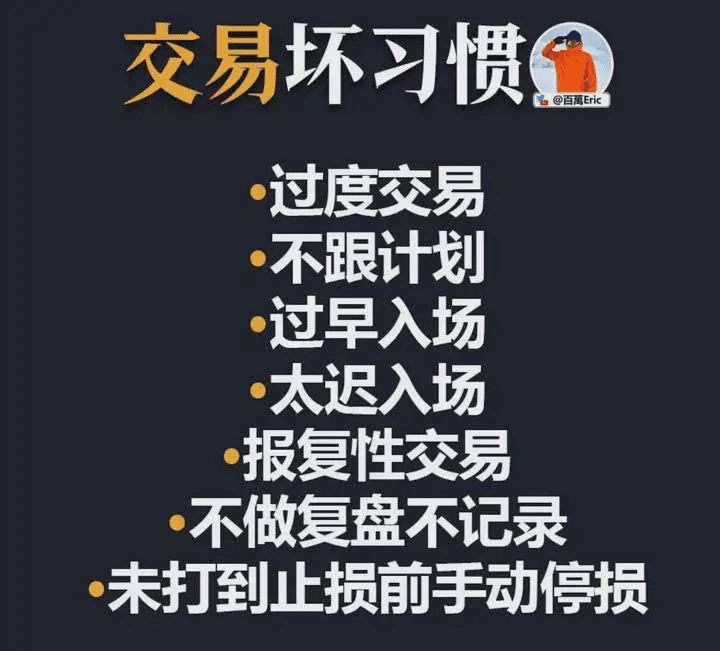
Today, let's talk about this topic—transitioning from pursuing quick money to pursuing long-term returns. This is not just a mindset adjustment, but a complete reconstruction of a systematic framework.
The trap of quick money thinking: Why do 90% of people fall into pitfalls?
The essence of human greed.
To be honest, no one dislikes quick money. Especially in the crypto space, where the market never sleeps, seeing those spikes of dozens of points, who wouldn’t feel tempted? I remember during the 2021 bull market, buying any altcoin could double your investment; that feeling was indeed exhilarating.
But the problem lies here. When you taste the sweetness of quick money, your brain secretes dopamine, and this feeling can make you addicted. It’s like gambling; you always feel that the next time you can make a big win.
I have seen too many such examples. A friend of mine used 100,000 in capital for high-frequency arbitrage and made 80,000 in a month. Then he thought he had found the secret to wealth and directly increased his position to 500,000. As a result, he encountered a black swan event and lost everything in three days, even owing the exchange several thousand.
The fatal flaw of the quick-money strategy.
In pursuit of quick money, many people will adopt seemingly impressive strategies:
High-leverage trading often goes up to 20x or 50x leverage, thinking that this way they can quickly amplify returns. However, high leverage is like a double-edged sword; while returns are amplified, so are risks. I previously wrote a simple risk calculator:
This simple calculation shows that the higher the leverage, the greater the probability of liquidation. Many people only see the magnified returns but overlook the skyrocketing risks.
Frequently changing strategies: Seeing others make money with grid strategies leads one to adopt grid strategies; seeing others profit from trend-following leads to following trend-following. No strategy lasts more than a month. This behavior is like jumping between different restaurants, never finding out which one truly suits your taste.
Neglecting risk control: In pursuit of maximizing returns, many people will ignore basic risk control principles. Stop-loss settings are too wide, or simply not set at all. Position management is also a mess, sometimes heavily investing in one cryptocurrency, and other times overly diversifying.
The market's reality education.
There is a saying in the crypto world: 'One day in the crypto space is like a year in the human world.' The volatility of this market is indeed very large, and there are many opportunities, but there are also many traps. I have compiled our team's trading data from 2020 to now and found an interesting phenomenon:
About 70% of people choose to exit the market after experiencing significant losses, while only 30% truly reflect and adjust their trading methods. Among this 30%, only half can truly transform into long-term stable traders.
Long money thinking: The true wealth code.
The magic of compound interest.
Einstein once said that compound interest is the eighth wonder of the world. This saying is vividly reflected in quantitative trading.
Let me calculate a scenario for you. Suppose you have a capital of 100,000, with two choices:
Plan A (quick money thinking): Pursuing 30% returns every month, but facing a 50% drawdown every three months.
Plan B (long money thinking): A stable 5% return every month, with almost no major drawdowns.
Many people may find Plan A more tempting, but let's look at the actual results:
The results may surprise you. The quick money model appears to earn 30% each time, but due to the existence of drawdowns, the funds after a year may not even match the stable 5% monthly returns.
This is the power of compound interest. Stable small gains, through the accumulation of time, will ultimately outperform those large fluctuations in high returns.
Risk-adjusted return is the king.
In professional quantitative trading, we rarely look solely at returns; we pay more attention to the Sharpe Ratio. This metric considers risk-adjusted returns.
Generally speaking, a Sharpe Ratio greater than 1 is considered a good strategy, and greater than 2 is considered an excellent strategy. From this perspective, stable long-term strategies often have a higher Sharpe Ratio.
The importance of psychological accounts.
Another important concept in long-term trading is 'psychological accounts.' You need to treat this money as a long-term investment rather than expecting quick results from the money you invest today.
I have a friend who treats the funds for quantitative trading as insurance for his future self. He invests a fixed amount of funds every month and then forgets about it. Three years later, the growth of this fund has exceeded his salary income.
Institutional building: From casual to standardized.
Standardization of strategy selection.
After shifting to long-term thinking, the criteria for strategy selection should also change. One should no longer rely on intuition or follow others just because they are making money; instead, a scientific evaluation system should be established.
Strategy master.
Improvement of the risk control system.
Risk control is the lifeline of long-term trading. I have seen too many people lose everything due to a single risk control mistake.
We use the Kelly formula to calculate optimal position sizing.
Diversified investment means not putting all eggs in one basket. We usually run 4-6 unrelated strategies simultaneously, which can effectively reduce the overall volatility of the portfolio.
Dynamic stop-loss: Traditional fixed stop-loss tends to be frequently triggered in volatile markets. We use ATR (Average True Range) to set dynamic stop-loss.
Emotional management system.
The biggest enemy in trading is often not the market, but one's own emotions. Establishing an emotional management system is very important.
A trading diary records the thoughts, emotional state, and market observations of the trades every day. This not only helps you review your trades but also allows you to better understand your trading habits.
Cooling-off period system: When continuous losses exceed a preset threshold, trading must be forcibly stopped for a week. At this time, your emotions have often been affected, and continuing to trade will only worsen the situation.
Regularly review every month to conduct a comprehensive review of your trades, analyzing what was done well and what needs improvement.
Complete transformation of mindset.
From speculator to investor.
This transition is the most difficult and the most important. Speculators focus on short-term price fluctuations, while investors focus on long-term value growth.
I remember when I first started doing quantitative trading, I had to check my account countless times every day. Seeing profits made me excited, while seeing losses made me anxious. Later, I slowly realized that this mindset is not conducive to long-term trading.
Now I generally check my account details once a week, and every day I just briefly check for any unusual situations. This change has made my trading decisions more rational and stable.
Accept short-term uncertainty.
The market is unpredictable, and any strategy will have times of underperformance. Accepting this uncertainty is a mindset that mature traders must possess.
I previously used a grid strategy that performed well in volatile markets, but during the bull market of 2021, it underperformed significantly. At that time, I was a bit anxious and wanted to adjust the strategy parameters. However, later when the market entered a volatile period, this strategy began to perform excellently again.
This experience made me realize that no strategy can perform well in all market environments. It is important to be patient and give the strategy enough time to prove itself.
Learn to enjoy the process.
The most important thing in long-term trading is to learn to enjoy the entire process, not just focus on the results.
Now, the time I enjoy the most is during my nightly review. I look at what happened in the market today, how various strategies performed, and what can be improved. This process of continuous learning and improvement gives me a sense of accomplishment that surpasses mere profit.
The big coin has been soaring, bringing some previous trading strategies back to life. The simplest and most direct one might be the MACD trading strategy of the so-called demigod in the crypto space, claiming to achieve 400 times returns in a year.
It can be said that it is actually simple, it is merely about looking for opportunities for continuous divergence in MACD.
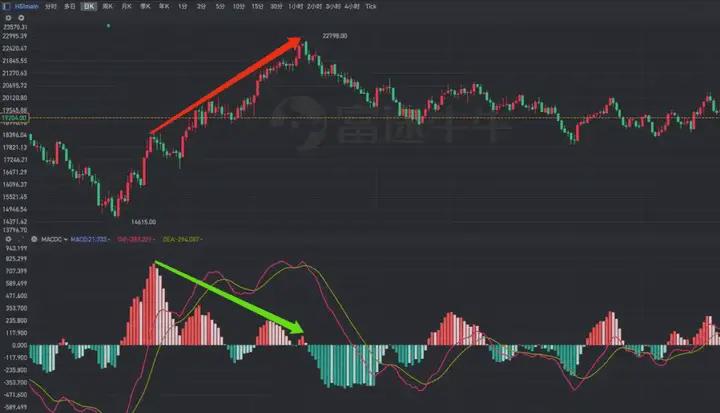
The above figure is a good example, fully illustrating the two core points of this trading strategy: continuity and divergence.
What counts as continuous?
When MACD is above the zero axis, after a peak occurs without dropping below the zero axis, it rises again and another peak appears, or after dropping below the zero axis it quickly crosses golden again and another peak appears, this is what is referred to as continuity.
What counts as divergence?
The peaks of MACD are gradually decreasing, while the stock price is gradually rising, meaning that the trend of MACD is inconsistent with the trend of the stock price; this is what is referred to as divergence.
Of course, inconsistencies in trends can be divided into two situations: If the indicator declines while the stock price rises, it is a top divergence; if the indicator rises while the price declines, it is a bottom divergence.
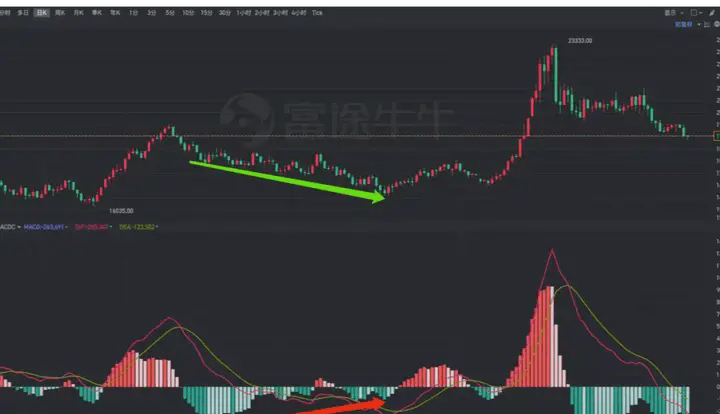
The demigod's trading strategy is to look for opportunities where the MACD indicator exhibits continuous divergence.
First change the two default parameters of MACD from 12 and 26 to 13 and 34, and then look for continuous divergences where the peaks and troughs differ significantly. Short at top divergences and go long at bottom divergences, then use the ATR with parameter 13 for stop-loss.
Causes of divergence.
From the above two screenshots, it is clear that going short at a top divergence and going long at a bottom divergence is indeed a great opportunity. Everyone can also test this strategy on the assets they are concerned about to see if it can capture some larger opportunities.
During this process, there may be two problems: First, the MACD indicator that comes with the platform only has fast and slow lines and a column chart, without added recognition of divergence, making it very inconvenient to validate the effectiveness of divergence signals based on historical data. Second, after backtesting, it is likely to find that divergence signals are quite effective, but bottom divergence is relatively more effective than top divergence.
How to solve the problem of divergence signal recognition, we will discuss that later. First, let's analyze the causes of divergence and why bottom divergence signals are more effective.
First, we need to look at the code of the MACD indicator and analyze the logic behind its construction.
DIF: EMA(C, 12) - EMA(C, 26), COLORRED;
That's right, the original MACD indicator is just that simple. It only takes three lines of code to implement the so-called 'king of technical indicators' MACD.
In the first line, the difference between two moving averages of different time periods is calculated based on the closing price and displayed as a curve.
In the second line, the difference between the two moving averages from the previous step is averaged again and displayed as a curve;
In the third line, the two are subtracted and enlarged, then displayed as a histogram.
So, even if we haven't studied the design principles of the MACD indicator, we can analyze the causes of divergence just from its code.
If a top divergence occurs, it means that the peaks of MACD are decreasing while the stock price is rising and reaching new highs. If this happens, it indicates that the value of MACD is declining.
The value of MACD is derived from the difference between DIF and DEA, indicating that the gap between DIF and DEA is narrowing.
DEA is the average of DIF, indicating that DIF is gradually decreasing or its increase is slowing down. At the same time, due to the smoothing effect of DEA, when DIF's increase narrows, DEA is still rising, causing the difference between the two to narrow or even reverse.
DIF is the difference between two different period moving averages. If DIF gradually narrows or the increase slows down, it means the difference between the two moving averages is decreasing. The short-term moving average is sensitive, while the long-term moving average is smooth. Therefore, if the difference between the two narrows, it can be viewed as the slope of the short-term moving average starting to approach the slope of the long-term moving average.
The slopes of the short-term and long-term moving averages are starting to converge. This can be due to two reasons: either the stock price has fallen or the increase has slowed down. The condition for top divergence is that the stock price is still rising and reaching new highs, so the narrowing of the difference between the two actually indicates that the increase is slowing down, which means stagnation has occurred and growth is halted.
The same derivation process shows that the cause of bottom divergence is a stagnation in decline.
After a long period of fluctuation, once a trend occurs, it becomes difficult to reverse. After a top divergence occurs, some profit-taking funds may cash out, but those who were not confident at first are now gradually starting to believe, entering the market. Although momentum has weakened, the trend remains, and after a top divergence, there can be another top divergence, with the stock price potentially forming higher highs.
Similarly, after a bottom divergence occurs, it is also possible to form a lower low. However, compared to an upward trend, a downward trend often takes a shorter time and has a larger amplitude. Especially after several rounds of panic emotion release, people become numb to negative news, and with nothing left to drop, the remaining ones are mostly steadfast holders. Coupled with the psychological advantage of buying at low positions, a strong rebound is often triggered, making the bottom divergence signals easier to realize.
Identify divergence.
If the stock price reaches a new high while the indicator does not reach a new high, this is a top divergence, indicating that the strength of the bullish trend is weakening and the market may undergo a top reversal; if the stock price reaches a new low while the indicator does not reach a new low, this is a bottom divergence, indicating that the strength of the bearish trend is weakening and the market may undergo a bottom reversal.
Since this is a 'potential reversal,' it indicates a left-side trade. If the trade is also in contracts, it explains why the demigod can achieve such high returns relying on this strategy.
Of course, since it is a left-sided approach, there may be situations of 'top within a top, bottom within a bottom, and divergence after divergence.' Therefore, the demigod trading strategy also specially adds stop-loss based on ATR to avoid reverse trading contracts in a strong trend, which could lead to a total loss or liquidation risk.
There are both entry signals and stop-loss rules. Logically, this is a relatively complete trading strategy. But the problem is, if we rely on the naked eye to identify the situation of continuous divergence in MACD, the efficiency may be very poor.
Although there are related indicators in TradingView to assist trading, such tools are rarely found in domestic trading software. Most have a flashy name, giving the illusion that one can make a profit just by trading based on indicator signals.
However, we all know that different markets, different assets, and different time frames require different treatment of trading signals.
In a strong trending market, the KDJ indicator may always be in the overbought and oversold range; in a volatile market, moving average indicators may frequently experience golden and dead crosses. If you rely entirely on a single signal, you may end up losing your pants after a while.
So, in fact, technical indicators should be viewed more as auxiliary tools, and their main function should be to improve efficiency. For example, for continuous divergence in MACD, if we can achieve automatic recognition of this pattern through technical indicators, it can help us better seize such opportunities.
Identifying divergence has three key points: triggering mechanism, time range, and judgment method. In previous articles, we introduced a simple method for recognizing divergence using MACD.
This identification method is very simple, which is to use the MACD golden cross and dead cross as a triggering mechanism, using two golden crosses/dead crosses as a time range, and then judging whether divergence has occurred based on the price movements of DIF when the golden cross and dead cross occur.
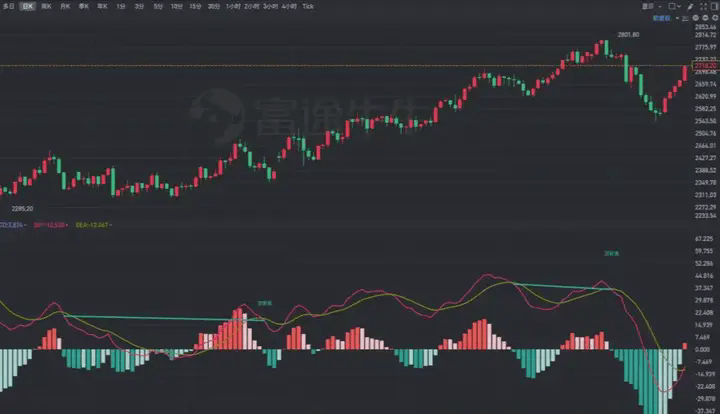
This actually belongs to a kind of opportunistic method. It can barely be used for a general overview, but it is clearly wrong to rely on demigod trading strategies to identify signals.
For example, continuous top divergence refers to several consecutive peaks that gradually decrease, and there is no pullback to below the zero axis between peaks, or even if there is a pullback, it only consists of a few columns.
Therefore, its triggering mechanism is to first find the peaks, then look back at the position of the previous peak, check whether there is a portion below the zero axis between the two peaks, and if so, check whether the number of columns below the zero axis exceeds the threshold. Finally, judge whether both peaks are declining while the corresponding stock price is still rising.
Similarly, continuous bottom divergence requires first the appearance of troughs, then looking back to the previous trough to see whether there is a portion above the zero axis between the two troughs. If so, check whether the number of columns above the zero axis exceeds the threshold, and finally judge whether both troughs are rising while the stock price is still falling.
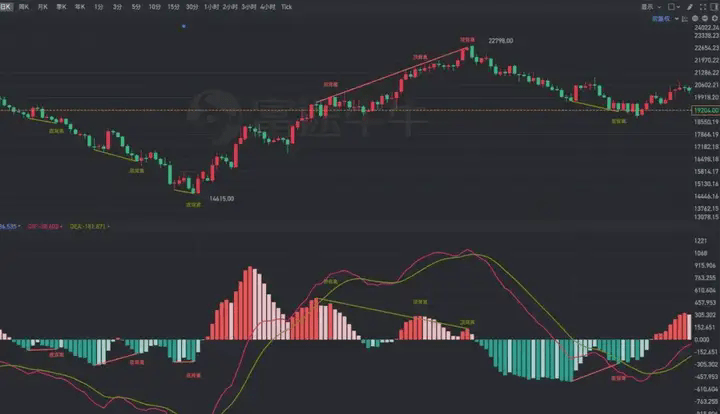
Comparing with the first chart, we no longer need to measure whether continuous divergence has occurred by drawing lines manually. By using customized technical indicators, we can recognize whether MACD has diverged on the sub-chart and connect the peaks and troughs, then on the main chart connect the corresponding highest or lowest prices of MACD's peaks and troughs. This way, divergence can be clearly recognized at a glance.
Of course, since it is a customized indicator, the conditions for continuous divergence can be set according to one's own preferences, such as whether two or three peaks and troughs should appear continuously, the number of columns below the zero axis between peaks, and the differences in consecutive peaks and troughs must reach a certain threshold; these can all be adjusted.
Identify trends.
The trading strategy based on divergence will enter the market before the trend is fully confirmed, exhibiting the characteristics of left-side trading. Therefore, stop-loss based on ATR is indispensable as an important component of the demigod trading strategy.
However, we can definitely combine with other technical indicators to further reduce the potential risks brought by left-side trading. MACD measures the strength of the trend, while the trend itself can naturally be measured using moving average indicators.
Generally, most strategies identify trends based on the crossovers of short-term and long-term moving averages. However, there is a long-standing issue: if the two time parameters are too close together, the two moving averages may frequently cross, resulting in a large number of invalid signals; if the two time parameters differ too much, the timing for entering and exiting trades will be severely delayed.
Therefore, we can adopt the following method: choose a personal preferred time parameter, and then select different moving average algorithms to obtain the fast and slow lines.
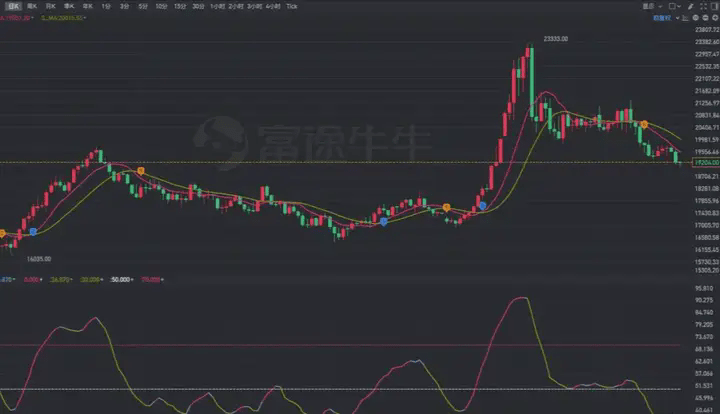
For example, we first calculate MA10 based on the closing price, and then calculate the EMA10 of MA10, thus imitating the calculation principle of DIF and DEA to obtain two fast and slow lines, and then formulate buy and sell signals based on the crossover of these two lines.
Of course, this method, compared to traditional dual moving averages, although it only has one time parameter, cannot avoid the problem of needing to filter out invalid signals.
The market is mostly in a state of fluctuation, so we can use whether it is overbought or oversold as a filter for the moving average crossover signals.
For example, when the dual moving averages have a golden cross, and the RSI indicator is in the range of 50-70 (above 70 is considered severely overbought, do not chase high) and is rising, it is considered an effective signal to go long; when the dual moving averages have a dead cross and the RSI indicator is in the range of 30-50 (below 30 is considered severely oversold, do not chase low) and is falling, it is considered an effective signal to go short.
At the same time, further restrictions can be placed on the candlestick chart. When going long, the lowest price should be above the fast line, and when going short, the highest price should be below the fast line. This way, the effects in the figure below can be achieved.
Conclusion:
Remember: If you survive in the crypto space for more than 5 years, you have already surpassed 90% of people.
The market is always changing, but human nature has never changed. The red and green bars in the candlestick chart are essentially a game of greed and fear. I was able to rise from three liquidations, relying not on luck, but on repeating and diligently applying simple principles.
You may still be at a loss now, but as long as the direction is right, every step brings you closer to profit.
The door to the crypto world is always open for those who understand discipline; the key is whether you are willing to let go of luck and embrace the rules.
To sail through the sea of books, one must be diligent; to trek on the path of learning, one must persist. You will surely return with a full load from the journey of knowledge. Helping others is like helping oneself; I am the sunny day, willing to walk with you. Here, not only do we teach fishing, but we also give fish! Daily updates on the essence of trading cryptocurrencies are unmissable.
Welcome to follow Rongrong, where you can learn and communicate with real market data, and clearly understand the direction and strategies of the market. Regardless of the market style, knowing in advance allows for better mastery!!!
The team still has positions available, get on board quickly to become a big player and a winner.

