


If your funds are under 50,000, and you want to achieve quick success in the crypto market through short-term trading, please read this post carefully. After reading, you'll surely have a clear understanding of the essence of short-term trading!
Not choosing finance or computer science as my major in college is one of the biggest regrets in my life. I started getting exposed to Bitcoin and blockchain through the internet at an early age, and I was fascinated by the magical candlestick charts and revolutionary concepts. Driven by endless憧憬 for the crypto world, I got involved in trading early on, thus beginning this journey full of challenges and opportunities.
Like most newcomers to the space, I was initially fascinated by various technical indicators and on-chain data, constantly backtesting and trying to find the 'holy grail'; I was eager to catch the bottom of low-priced altcoins or so-called 'value coins' that had already dropped by over 90%, believing they had higher 'margin of safety.' The harsh reality taught me that most of these initial market perceptions were mostly wrong and dangerous.
It was only later that I painfully understood: If you want to quickly and relatively controllably gain profits in the highly volatile, 24/7 market of cryptocurrencies, focusing on short-term hot trends is almost the only feasible path (for small funds). The core of short-term trading lies in identifying the mainstream narrative tracks and accurately grasping the emotional cycles. Mainstream narratives give birth to leading coins, and the crazy surge of leading coins further reinforces and spreads that narrative. Often, the coins that contribute the most to your account and are the most efficient are those leading coins at various stages. In a raging bull market, they provide the strongest explosive power; during partial rebounds, they often start first and are relatively 'anti-fall' (note: 'safety' in the crypto space is relative!). In 2021, I also captured the most rapid upward waves of my career on leading tracks like SOL and MATIC.
Buying the same coin at different market sentiment stages and narrative cycles yields vastly different results! The sentiment cycle tells you: when you can boldly strike, even leverage (with caution!); when you must hold back, or even short (if capable); and when you should completely exit and observe. The mainstream narrative of the market tells you where the funds are attacking (is it AI, MEME, new public chains, or Layer 2?). This is the correct, top-down speculative mindset. Unfortunately, many friends completely reverse this, acting against the trend and against market sentiment, leading to being ruthlessly harvested.
There is a saying that left a deep impression on me: 'If you don't occupy the heights of cognitive awareness, FUD (Fear, Uncertainty, Doubt) and FOMO (Fear of Missing Out) will occupy it.'
Today, I share with you this set of short-term survival and offensive tactics in the crypto space, which is the core logic that supports my survival and continued profitability in this market, which is bloodier, faster, and more unpredictable than the stock market. If you can calm down to understand, practice, and ultimately internalize it, your understanding of 'trading coins' will surely change drastically!
Closely follow Bitcoin's fluctuations
Bitcoin is considered the barometer of the crypto market, with most altcoins' fluctuations influenced by it. Coins like Ethereum, which have a strong conceptual logic, may occasionally diverge from Bitcoin to form a unilateral trend, but other altcoins generally cannot escape Bitcoin's 'control.' Therefore, closely monitoring Bitcoin's trading fluctuations can provide important references for our trades in other coins.
Seize the golden moment for trading
Every day from 12 AM to 1 AM is a special trading period in the crypto space, where the 'golden line for cashing in' phenomenon is likely to occur. This is the trading volume period for most of the world, and various unexpected situations can happen. Friends who want to buy at a low price or sell at a high price can set a super low buy order before going to sleep, or set an ideal sell order for passive earnings; you might just get lucky.
Pay attention to USDT price movements
Generally, USDT and Bitcoin move in opposite directions. When USDT rises rapidly, be alert to a potential Bitcoin drop; when Bitcoin rises, it's often a golden low point for buying USDT. By grasping the price movement relationship between the two, you can make better trading decisions.
Follow financial news from central banks around the world
The volatility in the crypto space is heavily influenced by the attitudes of various governments towards Bitcoin. If governments take measures to crack down or control it, the market is likely to decline. Additionally, changes in U.S. financial policy, such as the recent talk of taxing the wealthy, will also have a significant impact on the crypto market. Therefore, following financial news from central banks around the world is an essential task for traders.
Seize key time periods
Every day from 6 AM to 8 AM is a key period for judging buy and sell points, and it can also help determine the trend of the day's rise or fall. If the price has been dropping from 0 AM to 6 AM and continues to drop during that period, this is a good time to buy or add positions, and it will likely rise that day; if the price has been rising from 0 AM to 6 AM and continues to rise during that period, this is a selling opportunity, and it will likely drop that day.
Pay attention to 'Black Friday'
In the crypto space, there is a saying about 'Black Friday', where Fridays often see significant drops, but there are also times of sideways movement or significant rises. Although not particularly accurate, you still need to pay attention to the news.
Pay attention to trading volume
Trading volume is the lifeline of cryptocurrencies. For cryptocurrencies with a certain trading volume guarantee, if the price drops, there's no need to worry too much; patiently holding will likely bring back the capital. Sometimes it may take a week, other times even a month. If you have spare money, you can add positions in batches to lower the average cost; if you don't have spare money, just be patient and wait, it often won't let you down.
Avoid frequent trading
The same cryptocurrency, holding on to spot purchases for the long term usually yields much higher returns than frequent trading; this tests the investor's patience. Frequent trading can not only increase transaction costs but also easily lead to mistakes due to emotional fluctuations.
The use of candlestick moving averages
In crypto trading, the candlestick theory has certain applicability, but not all indicator analyses are useful. Although the accuracy of candlestick techniques is not 100%, many people find it not very useful after learning it. In fact, according to the experience of many experts, candlestick techniques play a key role in analyzing long-term price trends. No matter where the price goes, it will be reflected in trading, and we can use these techniques to understand price movements.
Moving average rules: Constructing trend frameworks
In the trend cycle of the 1-hour chart, we can use three EMA moving averages to construct a trend framework: the fast line 21 represents short-term momentum, the medium line 55 reflects medium-term direction, and the slow line 144 defines long-term trends. When the moving averages are in a 'fast line > medium line > slow line' bullish arrangement, the market is in a strong upward cycle; conversely, it is dominated by a bearish trend. This arrangement can effectively filter out noise; even if the moving averages turn, as long as the order of arrangement has not changed, the trend direction remains valid.
However, moving averages have the disadvantage of lag. We can compensate for this through the 'trend candlestick confirmation' mechanism: when the price breaks through the moving average arrangement, wait for the 15-minute chart to show the same direction candlestick (like a large bullish candlestick in a bullish trend) before entering. This way we can avoid false breaks and capture the trend acceleration phase. The parameter selection also has its logic: a 21-period corresponds to monthly fluctuations, a 55-period aligns with quarterly trends, and a 144-period resonates with the annual line. This combination has a stable win rate of over 65% in historical backtesting of forex, futures, etc., with a risk-reward ratio of 1:2.3.
The support and resistance effect of moving averages
Important parameters of moving averages have support and resistance effects. When the market tests important parameter moving averages from below, it will face pressure, with expectations of a pullback or downward reversal; when the market tests important parameter moving averages from above, it will gain support, with expectations of a pullback or upward reversal. In practice, we can select these important parameter moving averages and combine them with some reversal structures or patterns for trading.
For example, in the 1-hour chart of ETH/USDT in May 2024, the EMA 21/55/144 shows a bullish arrangement, but the price has consecutively tested the 55 moving average three times without breaking it. At this point, observe the 15-minute chart and notice that each test is accompanied by shrinking trading volume and doji patterns, which is a typical 'trend continuation signal.' Eventually, ETH broke through the previous high, with a single wave increase of 37%.
Using moving average crossing to judge trend and entry timing
The crossing of moving averages is also a commonly used analysis method. By adding two moving averages on the chart, the smaller parameter is the fast line, which changes quickly; the larger parameter is the slow line, which changes slowly. The crossing of moving averages has two main uses: one is to judge direction, where the slow line crossing above the fast line confirms a bullish trend; the slow line crossing below the fast line confirms a bearish trend. The second is to determine entry signals, where the slow line crossing above the fast line signals entry for long positions; the slow line crossing below the fast line signals entry for short positions.
For example, in a certain 1-hour level k-line chart of spot gold, when the k-line drops below the moving average, it indicates a bearish trend. Wait for the k-line to test the moving average and gain pressure without breaking it, and then break below the previous low to enter short; set the stop loss at the high of the pullback. After entering the first order, if the market experiences a drop and subsequently tests the moving average again and gains pressure, you can enter again to add positions after the second break below the low.
Combining moving averages with other indicators
Moving averages can be used in conjunction with Fibonacci retracement, MACD, and other indicators to improve the accuracy of trading decisions. For example, after confirming direction with a moving average golden cross or death cross, the market has usually moved a certain distance, making the risk-reward ratio of entering at this time potentially unreasonable. Combining with Fibonacci retracement, enter at key positions of trend corrections, allowing for smaller stop-loss spaces and more reasonable risk-reward ratios.
Similarly, when the market tests the moving average with a reversal expectation, if the MACD also shows a divergence pattern, it creates a resonance for market reversal. You can combine with smaller moving averages to enter, as this operation has a small stop-loss space; if the market moves out, the risk-reward ratio will be ideal.
Trading is a long-term practice. To achieve success in the crypto space, you must follow the rules and build your trading system. I hope this set of trading strategies can provide useful references for your trading in the crypto space, and I wish everyone can achieve ideal returns.
The key point is coming! Next, I will share the application of candlestick moving averages. We all know the importance of candlesticks in the stock market.
In the crypto space, these candlestick theories only apply to some parts and not all indicator analyses are applicable.
Although the accuracy of candlestick techniques is not 100%, many candlestick concepts may feel less useful after learning.
Actually, based on the experience of many experts, candlestick techniques play a key role in long-term price analysis.
No matter which direction the price heads, it will be reflected in trading. We can use these techniques to understand price movements.
The direction of price movements, candlesticks tell about high probabilities, guiding you on a bright path when you're confused.
Without further ado, let's get to the point.
A major taboo in the crypto world: trading without understanding candlestick charts. This article will help you easily understand candlesticks.
Many people enter the crypto market, confusedly trading coins while wanting to make some money, without understanding candlestick charts. The biggest taboo in the crypto space is not understanding candlestick charts; let's talk about the candlestick chart in the crypto space.
Candlestick: Also known as yin-yang candles. Specific meanings are shown in the image below:
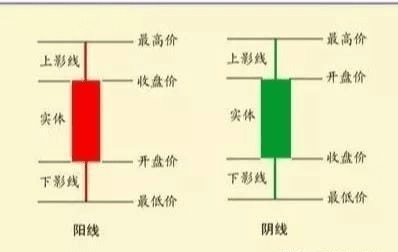
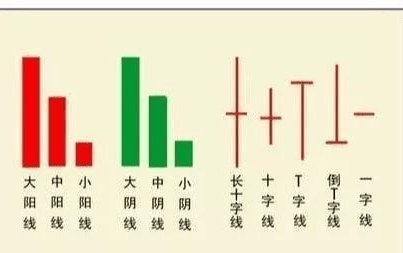
Candlesticks can be classified into three types based on shape: bullish candlesticks, bearish candlesticks, and doji candlesticks.
Bullish candlesticks can be categorized into large, medium, and small bullish candlesticks. Bearish candlesticks can also be categorized into large, medium, and small bearish candlesticks. Candlesticks at the same price refer to a special form of candlestick where the closing price equals the opening price, such as doji and T-shaped candlesticks.
Candlestick charts can be divided by time into daily, weekly, monthly, and yearly candlesticks, and can also be divided into intervals within a day, such as 5-minute, 15-minute, 30-minute, or 60-minute candlesticks.
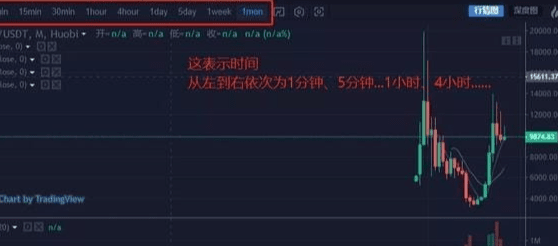
These candlesticks have different functions. For instance, the daily candlestick reflects short-term price movements. Weekly, monthly, and yearly candlesticks reflect mid- to long-term price trends. 5-minute, 15-minute, 30-minute, and 60-minute candlesticks reflect ultra-short-term price movements.
Their drawing methods are quite similar. For instance, a weekly candlestick can be drawn by finding the opening price on Monday, the closing price on Friday, and the highest and lowest prices during the week. The time indicated on the computer's weekly candlestick is always the closing price's time.
Monthly candlesticks: Observe long-term trends, allowing you to see the upward or downward trends of the market from a larger time frame.
(Note: The 5-month moving average on the monthly candlestick is equivalent to the 100-day moving average on the daily candlestick, and the 6-month moving average is close to the 120-day moving average.)
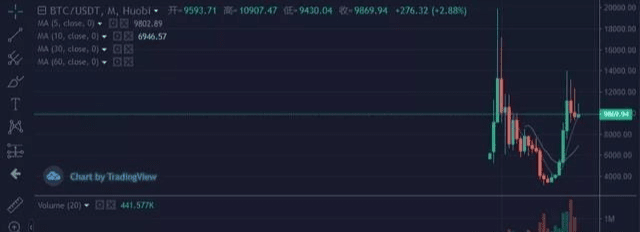
For example: When the May and October moving averages of the current month's candlestick show a divergence or dead cross, it often indicates that a significant downtrend has begun. At this point, if you haven't stopped loss, you must decisively cut your position and exit! Conversely, it indicates that a significant uptrend has begun, and if you haven't built your position, you should buy in. Weekly candlesticks are essential for observing mid-term trends, and they are the most practical candlesticks to watch daily. (Note: The 5-week moving average on the weekly candlestick is equivalent to the 25-day moving average on the daily candlestick, and the 10-week moving average is equivalent to the 50-day moving average on the daily candlestick)
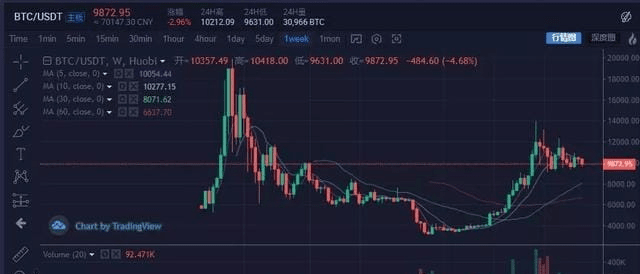
For example, when the 5-week and 10-week moving averages curve upward and show a golden cross, it indicates that the market or individual coins have entered a strong state, and a good market trend will occur.
Conversely, it indicates that the market or individual coins have entered a weak state, often leading to a significant downtrend. At this time, timely stop-loss and exiting are necessary; do not hold onto false hopes.
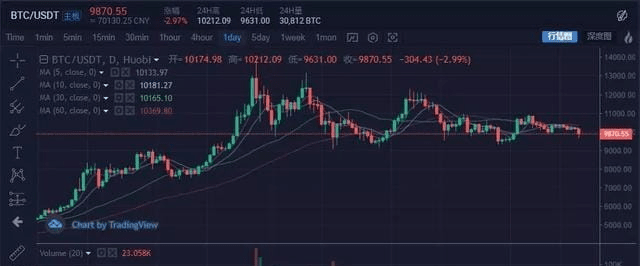
Daily candlesticks: The most practical candlestick chart for observing short-term trends, viewed most frequently.
By using short, medium, and long-term moving averages, it's easy to judge the strength of the market or individual coins. Using daily MACD in conjunction with moving averages and volume changes can help determine good entry points for buying coins. When strong, it can also effectively determine selling points on daily candlesticks.
Minute candlesticks: Observe ultra-short-term trends.
There are 60, 30, 15-minute candlestick charts; they can help you see the detailed changes of rising or falling that are not visible on weekly or daily candlestick charts. They are essential for short-term trading.
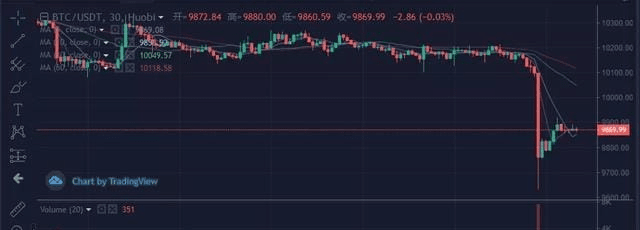
The 10-hour moving average on the 60-minute candlestick is equivalent to the 3-day moving average on the daily candlestick, while the 20-hour moving average is equivalent to the 5-day moving average on the daily candlestick.
Therefore, during short-term operations, it is better to refer to 60-minute and 30-minute candlestick charts.
When you have a principal of 1 million, the world truly changes: even without leverage, a 20% increase in spot prices means 200,000, which is often the ceiling for many people in a year. More importantly, making it from a few thousand to 1 million means you've grasped the logic of making money, and your mindset has stabilized; afterwards, it's merely about copying and pasting.
Don't keep shouting 'I want to make tens of millions or a billion'; start from your own pocket. Bragging only makes the braggers feel good, money is earned bit by bit.
The core of trading is being able to distinguish the size of opportunities: You can't just keep trading lightly without commitment, nor can you gamble with heavy positions every day. Usually, practice with small trades to build a feel, and when a big opportunity arises, bring out the 'big guns'—rolling positions are prepared for these moments.
It is possible to roll into three or four times in a lifetime, going from 0 to tens of millions is not difficult; it’s enough for an ordinary person to cross into the threshold of the wealthy.
So when is it suitable to roll positions? Only in three situations; give up on the rest:
1. Long-term sideways movement, volatility has dropped very low, it's time to choose a direction;
2. In a bull market, after a big rise, a sudden big drop occurs, this is the time to buy the dip;
3. Break through the weekly major resistance level (or break below major support), when the trend is about to change.
First, understand what rolling positions are: In a trending market, when you’ve made money using leverage, the actual leverage of your position will decrease. At this point, adding positions allows profits to continue rolling; that is rolling positions.
How to operate specifically?
- Floating profit increase: Buy again after making money, but first confirm that the holding cost has decreased, don't add blindly;
- Bottom position + trading: Divide your money into several parts; one part is held firmly (bottom position), and the other part is used for high selling and low buying. The ratio depends on how much risk you can bear; rolling half a position or rolling 30% of the bottom position is fine. The core is to reduce costs and increase profits.
There are only two 'good times' to add positions:
1. A sudden breakout from a converging range in the trend, add positions to ride the main upward wave; sell part of your added positions as soon as you make a profit;
2. When the trend pulls back near the moving average, buy in batches and wait for the next wave to surge.
Here's another 'foolproof method' that I've used to make some small profits without suffering losses:
1. If the market crashes drastically, but your coins only drop a little—this indicates that there are market makers supporting the price; hold on, and profits will come eventually.
2. Newbies should watch the 5-day line for short positions; hold if it's above, run if it breaks; for medium positions, watch the 20-day line, similarly, it’s simple and straightforward.
3. When the main upward wave arrives, buy decisively without volume. If it rises with volume, hold it; if it drops with low volume but the trend hasn't broken, hold it too; if it falls with volume and breaks the trend, quickly reduce your position;
4. After buying short-term, if there is no movement for three days, sell if possible; if it drops by 5%, don't hesitate, stop loss;
5. If a coin has dropped 50% from a high position, and has fallen for 8 days straight—it's oversold, a rebound could come anytime, you can give it a try;
6. Buy leading coins: They rise sharply and are most resistant to declines. Don't buy junk coins just because they've dropped significantly, and don't hesitate to chase after leading coins just because they've risen a lot. What leading coins need is 'buy high, sell even higher';
7. Follow the trend; the buying price isn't about being lower but rather the 'suitability' is most important. Don't guess the bottom when it drops; quickly throw away ineffective coins; the trend is more important than anything else.
8. Don't get carried away just because you've made some money; sustainable profits are the real skill. During review, think: was this luck or skill? Building a trading system that you can stabilize is better than anything else;
9. If you're not sure, don't trade; being in cash is also a strategy. The first thought in trading should be to protect capital, then to think about making money. It's not about the number of trades, but the success rate.
The 'wealth code' of long-term trends:
- Halving cycle: Buy BTC, BCH, etc., 180 days before Bitcoin's halving, and hold for 30 days after the halving;
- Leading recovery: If the leading coin has risen by 200%, look for the second tier in the same sector that has risen less (less than 50%);
- Triple verification on the technical side: Weekly MACD golden cross + daily breakout from the box + hourly volume bullish engulfing, this is the golden buying point;
- Institutional holdings: Seeing large addresses consistently buying on Glassnode, and on-chain trading volume surging is the signal to start;
- Dollar-cost averaging in a bear market: Invest 10% of your principal each month to buy BTC, ETH, and other blue chips, continuously investing for 12 months, with a high probability of over 300% returns.
Risk warning: These strategies should be adjusted according to real-time market conditions; novices should first use simulated trading. A single loss should not exceed 2% of total capital; the market is not an ATM.
Lastly, I want to mention one crucial thing that seems unrelated to trading but is actually foundational:
Step out of the market and live a balanced life.
Just like viewing landscape paintings, leaving blank spaces is the essence. The time traders spend not trading is often more important than the time spent trading.
Body, mindset, family, interpersonal relationships... If these are not handled well, trading will certainly have problems. For example, if you lack a sense of security, you may hold onto losing trades; if you want attention, you may operate blindly just to show off trades.
Fix the holes in your life, so you can truly relax and stay calm while trading. Just like those skilled traders, who have no worries at home and no health issues, when trading, they only focus on the market; how can they not win?
Write down these 10 suggestions, stick them on your computer, and read them every day.
Novices tend to focus on 'how to buy and sell', but the correct process of doing things is 100 times more important than analyzing the market or trading techniques. Even experienced traders often stumble here.
Think like a successful person, trade like a successful person, and handle your life like a successful person!
Welcome to follow Rongrong, where you can watch live trading for learning and exchange, and also clearly understand the direction and strategy of the market. No matter what style the market is, being able to know in advance allows you to better grasp it!!!
The team still has spots available; get on board quickly, become a major player, and also a winner.

