


Divided into two phases:
Phase 1: Use 1000 to roll over contracts quickly to accumulate 100,000! (It will take about 1 to 3 months)
In the cryptocurrency world, 1000 is about 140u!
Recommended optimal approach: contract
Use 30u each time to speculate on hot coins, ensure to take profits and stop losses 100 to 200, 200 to 400, 400 to 800. Remember, at most three times! Because in the cryptocurrency world, a bit of luck is needed. Each time you gamble like this, it's easy to make a profit 9 times and then lose once! If you pass three challenges with 100, then the principal will reach 1100u!
At this point, it is recommended to use a triple strategy to play
Make two types of trades a day, ultra-short trades and strategy trades. If the opportunity arises, take the trend trade
Short-term trades are used for quick, fast-paced trading. Advantages of trading on a 15-minute timeframe: high returns. Disadvantages: high risk.
Only making pancakes at the level of a auntie.
The second type of trade, the strategy trade, involves using a small position, such as 10x leverage (15 USDT), to trade contracts on a four-hour timeframe. Profits are saved and then regularly invested in Bitcoin weekly.
The third type is trend-following, medium- to long-term trading. The advantage is that you can profit more quickly once you've identified a clear trend.
Find the right entry point and set a relatively high risk-reward ratio.
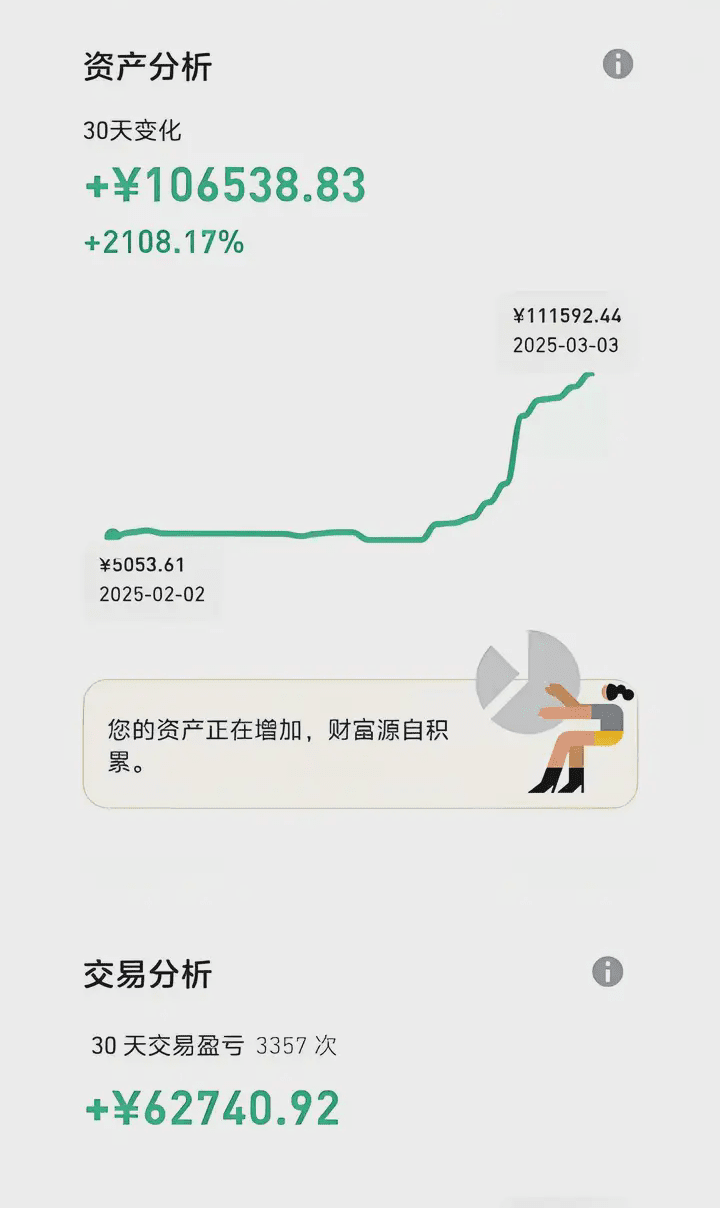
This is a method I've personally tested: from February to March 2025, in just one month, I turned 5,000 yuan into 100,000 yuan! The profit margin was 2108.17%!
Phase Two: Once you have 100,000, the next step is to reach 1 million! (This will likely take 1 to 4 years)
Having been in the cryptocurrency world for so many years, I've found that the most effective strategy is actually quite simple. I've personally tested a method with a 90% win rate (four-step strategy + three don'ts + six key points), simple and practical! Sharing it with everyone:
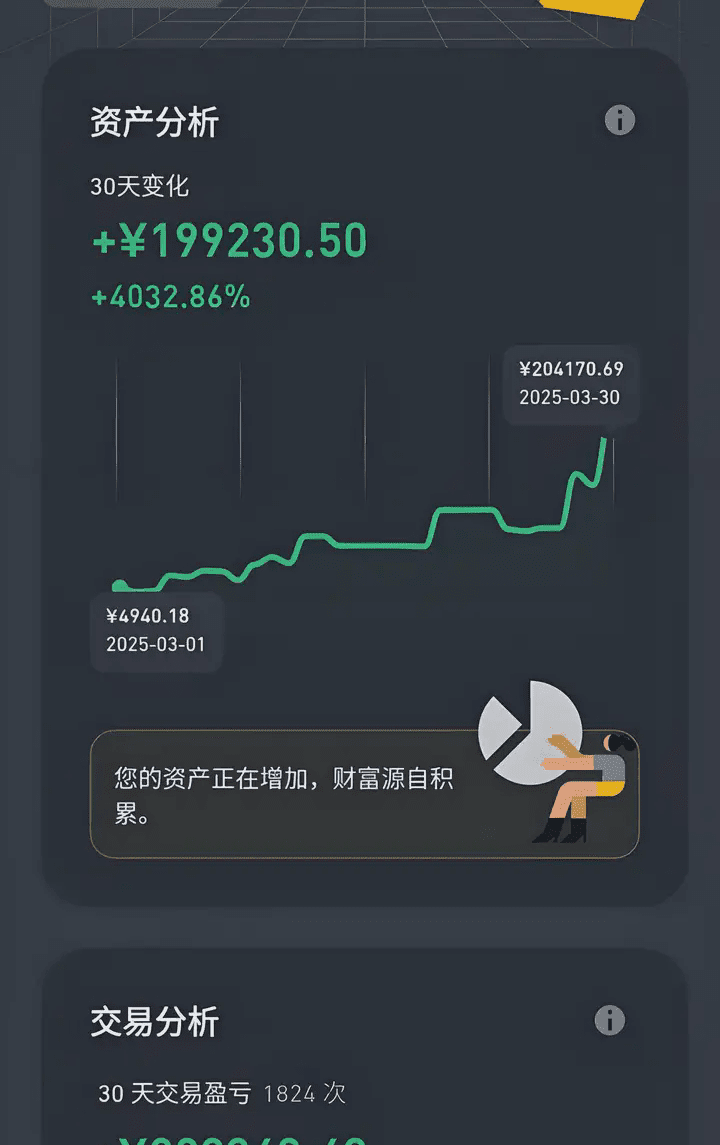
In March 2025, after spending a month, I made a profit of 4032.86% on 4945U, earning nearly 200,000U!
Step 1: Choose the right currency
Open the daily chart and look at the MACD indicator first. Only select coins with a golden cross signal (the MACD line crosses the signal line from bottom to top), especially those coins that show a golden cross above the zero line, as these signals have a higher success rate. Simply put, this is the market's "buy signal."
Step 2: Using moving averages to determine buying and selling points
Focus on one moving average – the daily moving average (e.g., the 20-day moving average). The rule is simple:
Holding online: Hold with confidence when the price is above the moving average;
Sell immediately offline: Once the price falls below the moving average, clear out your position immediately without hesitation.
This line is your "seatbelt." If it breaks, cut your losses. It's simple, straightforward, but effective.
Step 3: Position Management
Timing for adding to your position: If the price breaks through the moving average and the trading volume also increases and stabilizes above the moving average, you can consider adding to your position.
Sell in batches:
40% increase: Sell 1/3 first;
80% increase: Sell another 1/3;
If the price breaks below the moving average: Sell all remaining shares.
This helps lock in profits and avoids being trapped in a losing position.
Step 4: The Ironclad Rule of Stop-Loss
Moving averages are key. If a stock suddenly falls below its moving average the next day, you must liquidate your position immediately. Even if you chose a great coin, falling below the moving average indicates a trend change; don't stubbornly hold on. Wait until it stabilizes above the moving average before returning.
Three Don'ts: Avoid Common Pitfalls
Don't chase the price up.
Don't rush in when everyone's buying; instead, calmly observe when everyone's panicking. For example, if the price drops but the indicators start to improve, it might be an opportunity.Don't put all your eggs in one basket.
Diversify your funds across different currencies; don't put all your eggs in one basket. For example, divide your funds into five parts and invest in only one part at a time. This way, losses from a single mistake can be controlled.Do not trade with a full position.
Keep some spare cash to deal with unexpected situations. There are opportunities in the market every day; there's no need to bet everything at once.
Six Short-Term Trading Rules: A Summary of Practical Experience
Consolidation at high levels may lead to new highs, while consolidation at low levels may lead to new lows.
Wait until the direction is clear before taking action; don't rush into the market.Don't move around randomly when the price is consolidating.
Most people lose money because they can't resist trading at this point. Sideways movement means the market is preparing for a big move; patiently wait for the signal.Buy on a down day, sell on a up day
Consider buying when the daily chart closes bearish and selling when it closes bullish. Going against short-term fluctuations is often safer.The slower the fall, the weaker the rebound; the steeper the fall, the stronger the rebound.
Judge the strength of the rebound based on the speed of the decline, and adjust the strategy flexibly.Buy in batches to reduce risk.
For example, you could buy 10% initially, and if the price increases by 5%, you could add another 10%, and so on. This way, the cost is averaged out, and the risk is diversified.After a sharp rise or fall, the price will likely consolidate sideways.
After a period of continuous rise or fall, a period of consolidation usually follows. Don't sell all your shares at the high point, and don't buy all your shares at the low point; wait for a signal before taking action.
In conclusion: a steady and solid approach is the key to success.
remember:
Don't let your emotions get the better of you: Strictly follow the rules and don't let the impulse to "wait and see," "buy the dip," or "chase the rally" cloud your judgment.
Small profits keep coming: Accumulate small profits through buying and selling in batches and using moving average stop loss, and gradually compound them.
Leave room for maneuver: Diversifying funds and avoiding all-in bets are essential for long-term survival and profitability in the market.
The cryptocurrency market isn't lacking in opportunities; what it lacks is composure and patience. Using simple strategies to filter out noise and focusing on trends will lead to steady, long-term profits—a more reliable path than overnight riches.
I'm Rongrong, with extensive market experience across multiple financial sectors. Here, I cut through the fog of information to uncover the true market reality. Seize more opportunities to unlock wealth and discover truly valuable opportunities—don't miss out and regret it!
Unveiling Crypto Technical Analysis: 8 Essential Indicators to Help You Seize Market Opportunities! Applicable to both spot and futures trading!
In the cryptocurrency market, prices fluctuate rapidly, making it crucial for traders to accurately identify opportunities. This article will guide you through eight key technical analysis indicators for the cryptocurrency market, explaining their application methods and practical techniques to help you better recognize market signals and improve your trading success rate.
Cryptocurrency Technical Analysis Indicators: A Guide
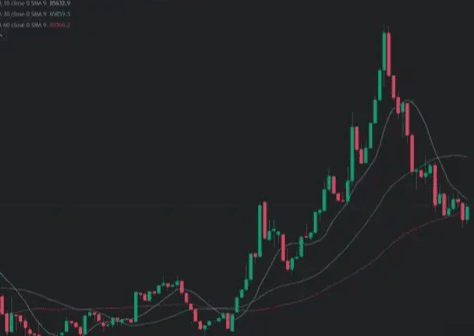
1. Moving Average (MA): A powerful tool for trend analysis
Definition: Moving averages smooth out data fluctuations by calculating the average price over a period of time, helping you to judge the overall market trend.
Application Tips:
Golden cross: When a short-term moving average crosses above a long-term moving average, it is often considered a buy signal.
Death cross: When a short-term moving average crosses below a long-term moving average, it may indicate a selling opportunity.
2. Relative Strength Index (RSI): Overbought/Oversold Signals
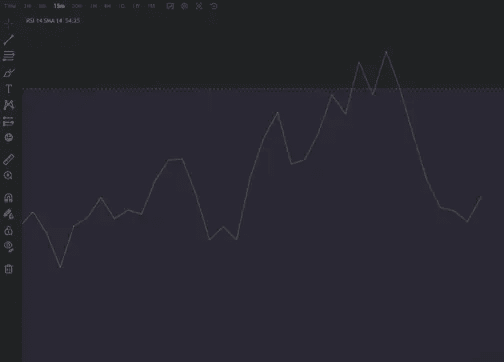
Definition: The RSI indicator measures the speed and magnitude of price changes, with a value range of 0 to 100.
Application Tips:
When the RSI exceeds 70, it usually indicates that the market is overbought and the risk is increased.
If the RSI is below 30, it may be in an oversold zone, presenting a buying opportunity.
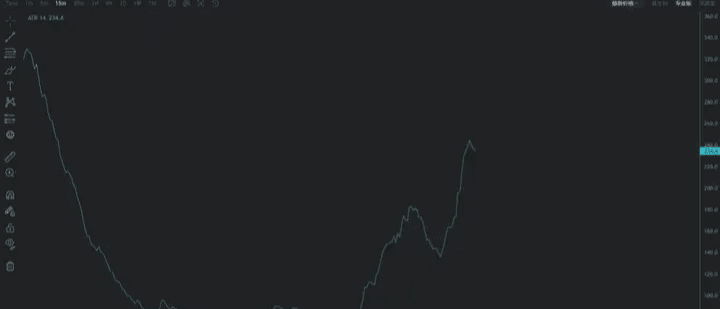
3. Mean True Range (ATR): A volatility indicator
Definition: ATR is used to measure market volatility; the higher the value, the more volatile the market.
Application Tips:
It can help you set a reasonable stop-loss level, such as setting the stop-loss at 1.5 times the current ATR, to reduce risk.
4. MACD Indicator: A Dual Validation of Momentum and Trend
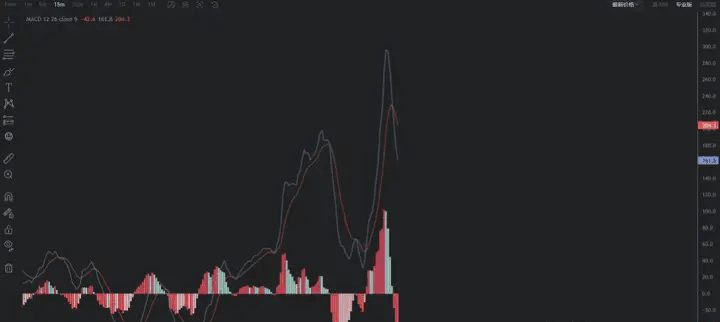
Definition: MACD uses the difference between two exponential moving averages (EMAs) to generate momentum signals.
Application Tips:
Crossover signal: When the MACD line crosses above the signal line, it is a buy signal; conversely, when the MACD line crosses below the signal line, it is a sell signal.
Bar chart changes: The expansion or contraction of the bar chart helps to judge the strength of the trend.
5. Bollinger Bands: Price fluctuation range
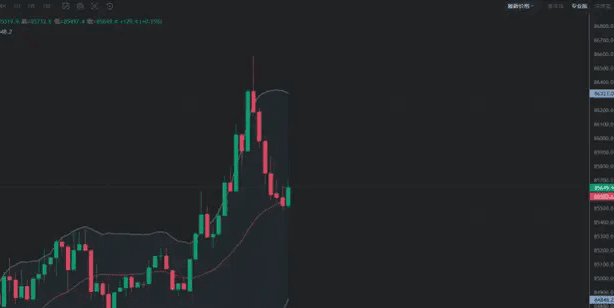
Definition: Bollinger Bands consist of a middle band (usually a 20-day SMA) and two standard deviation lines above and below.
Application Tips:
A price reaching the upper band may indicate overbought conditions, while a price reaching the lower band may indicate oversold conditions.
The narrowing of the Bollinger Bands indicates an imminent major market move, which warrants close attention.
6. Fibonacci Retracement: Finding Support and Resistance
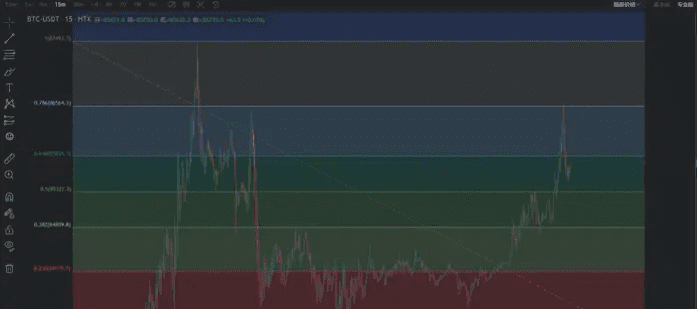
Definition: Based on the golden ratio (such as 0.382, 0.5, 0.618, etc.), determine the support and resistance levels for price retracements.
Application Tips:
In an uptrend, a pullback to the 0.618 level may present a buying opportunity;
In a downtrend, a rebound to the 0.382 Fibonacci retracement level may form a sell signal.
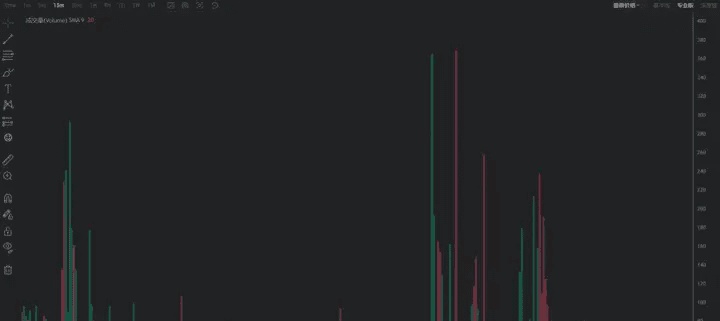
7. Trading volume indicator: a key indicator for verifying trends.
Definition: Trading volume reflects market activity and is usually analyzed in conjunction with price trends.
Application Tips:
If trading volume increases when prices rise, the trend is more reliable.
If prices rise but trading volume shrinks, be wary of a potential trend reversal.
8. KD Indicator: Capturing Short-Term Buying and Selling Opportunities
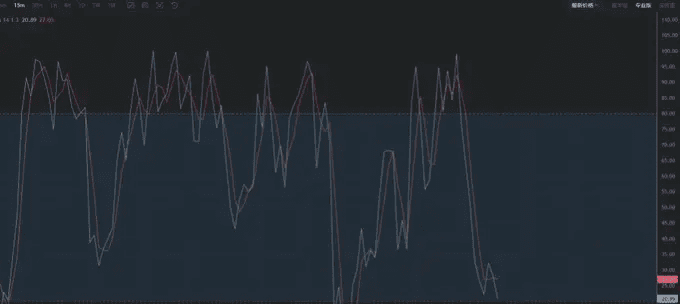
Definition: The KD indicator uses the Stochastic Oscillator method to determine price momentum.
Application Tips:
When the K-line crosses above the D-line: this is often a buy signal;
When the K line crosses below the D line, it may indicate a sell signal and is suitable for short-term trading.
Practical Tips: Indicator Combinations to Help You Establish Yourself in the Crypto Market
Single indicators often have limitations; in actual trading, it is recommended to combine multiple indicators.
MA and RSI combination: When the short-term moving average crosses above the long-term moving average and the RSI is not yet overbought, you can consider entering the market in line with the trend.
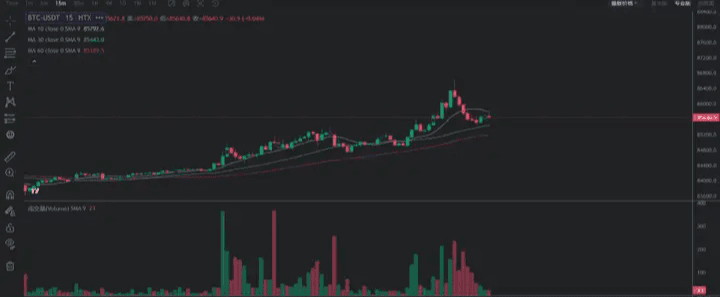
MACD and Bollinger Bands: The MACD crossover signal combined with the narrowing of the Bollinger Bands can help you capture entry opportunities before a market breakout.
Volume verification: Regardless of the indicator used, volume is always an important basis for judging the sustainability of market trends, and it is essential to observe it in conjunction with trading volume.
Conclusion
Technical analysis is only one part of cryptocurrency trading. Successful trading also requires continuous learning, practical experience, and sound risk management. Hopefully, the various indicators and practical combinations introduced in this article will be helpful. We also welcome everyone to exchange ideas and share their trading experiences. Wishing everyone steady profits and fewer pitfalls in cryptocurrency trading!
A must-learn for beginners! Mastering contract candlestick charts is essential for trading cryptocurrencies. Once you learn it, you'll thrive in the crypto world.
New to the cryptocurrency market and feeling overwhelmed by futures charts? Don't worry! Today, we'll teach you the simplest and easiest way to understand cryptocurrency futures charts, helping you improve your trading skills, capture market trends, and execute precise trades!
What is a contract candlestick chart?
First, we need to know that candlestick charts are one of the most common chart types in cryptocurrency trading and an important tool for judging market trends. They consist of information such as time periods, opening price, closing price, highest price, and lowest price, helping you observe market price fluctuations.
Candlestick charts are further divided into charts with different time periods, such as 1 minute, 5 minutes, 30 minutes, 1 hour, 4 hours, and daily charts. Shorter time period charts are more suitable for short-term trading, while longer time period charts are more suitable for medium- and long-term operations.
Basic components of candlestick charts
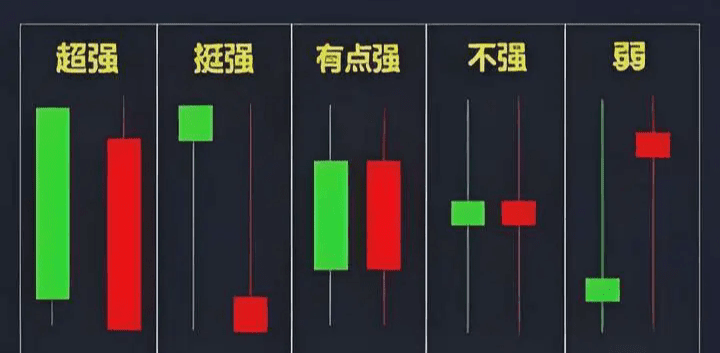
Each candlestick in a candlestick chart represents price changes over a specific time period. Each candlestick primarily consists of a **body** and **upper and lower shadows**. Understanding these components allows you to glean more information from the chart.
1. Entity (Body)
The solid portion represents the area between the opening price and the closing price.
If the closing price is higher than the opening price, the solid part is green or white, indicating that the market is rising.
If the closing price is lower than the opening price, the body of the candlestick is red or black, indicating a market decline.
2. Upper and lower shadows (Wicks)
Upper shadow: indicates the difference between the highest price and the closing or opening price within that period.
Lower shadow: Represents the difference between the lowest price and the opening or closing price within that time period.
How to interpret the trend of a contract candlestick chart?
Candlestick charts are not just composed of individual candlesticks; their combinations can help us determine market trends. By observing candlestick patterns, we can predict possible market movements. Here are some common candlestick patterns:
1. Engulfing Form
Bullish Engulfing: A large bullish candlestick engulfs a small bearish candlestick, suggesting that the market will rise.
Bearish Engulfing: A large bearish candlestick engulfs the previous small bullish candlestick, suggesting that the market will fall.
2. Hammer and Inverted Hammer
Hammer: A long lower shadow and a short body, usually appearing after a downtrend, indicating that the market may reverse upwards.
Inverted Hammer: A long upper shadow and a short body, usually appearing after an uptrend, indicating that the market may reverse downwards.
3. Doji (Cross Star)
A doji candlestick pattern indicates that the opening and closing prices are almost equal, and there is no clear body in the pattern. This suggests market uncertainty and may be a signal of a reversal.
How to use candlestick charts for trading decisions?
1. Find support and resistance levels
By observing the highs and lows in a candlestick chart, we can find support levels (levels at which prices may rebound when they fall) and resistance levels (levels at which prices may fall back when they rise).
Support level: When the price falls to a certain level, buying pressure begins to increase, and the price rebounds upward.
Resistance level: When the price rises to a certain level, selling pressure begins to increase, and the price falls back down.
2. Identify the trend
By observing the trend of candlestick charts, you can determine whether the market trend is upward, downward, or fluctuating.
An upward trend is typically characterized by a series of higher highs and higher lows on a candlestick chart.
Downtrend: This is typically characterized by a series of lower lows and lower highs on a candlestick chart.
Sideways market: Prices fluctuate within a certain range, and the candlestick chart shows a relatively stable trend.
3. Combine with other technical indicators
Candlestick charts are often used in conjunction with other technical indicators, such as MACD, RSI, and moving averages, to help you more accurately determine buy and sell signals and market trends.
Common application techniques of candlestick charts
1. Trend lines and channels
By drawing trend lines (straight lines connecting lows or highs) on a candlestick chart, you can visually see the market trend.
An upward trend line connects a series of gradually rising lows, indicating an upward trend in the market.
Downtrend line: Connecting a series of gradually decreasing highs indicates a downward trend in the market.
Price channel: Consists of two trend lines, one above the other, indicating that the price fluctuates within a certain range.
2. Candlestick Chart Combinations
Learning common candlestick patterns, such as triangles, flags, rectangles, and head and shoulders, can help you determine the potential breakout direction of the market.
Triangle pattern: It usually appears during the consolidation phase, where price fluctuations gradually narrow, indicating that the market is about to break out.
Tip: How to improve your ability to read candlestick charts?
Read and practice more: Only through continuous practice and review can you more accurately understand candlestick charts.
Trading with a demo account: Familiarize yourself with candlestick chart changes through simulated trading, without worrying about losses.
Be patient: Candlestick charts cannot be learned overnight. Only by gradually accumulating experience can you understand the deeper information of the market.
Summary: Understanding contract candlestick charts is key to mastering the market!
By mastering the basic components, common patterns, and trading decision-making techniques of candlestick charts, you can better understand the trends in the cryptocurrency market and make more informed trading decisions.
Whether you're a complete beginner to the cryptocurrency market or a seasoned veteran, candlestick charts are an indispensable tool! Through continuous learning and practice, you'll definitely discover more trading opportunities and earn more profits!

The following 15 tips will help even complete beginners quickly understand cryptocurrency knowledge.
Essential Terminology for Entering the Crypto World (A Must-Read for Beginners) This section provides explanations of crypto terminology, which beginners may find helpful.
1. What is legal tender? Legal tender is currency issued by the state and government, and is guaranteed only by the government's credit, such as RMB, USD, etc.
2. What does Token mean? Token is usually translated as "token" or "certificate." Token is one of the important concepts in blockchain. While it's more commonly known as "token," in the eyes of blockchain professionals, a more accurate translation is "token," representing a kind of proof of rights on the blockchain, rather than currency. In traditional value systems, only things that can be recorded in a ledger can be exchanged and circulated. Therefore, bookkeeping is the foundation of wealth generation. However, in the real world, most things cannot be quantified, and the things that can be recorded are extremely limited. But "Token" can. The amazing thing is that Token can record physical assets and virtual digital assets digitally.
3. What is an airdrop? An airdrop is a very popular cryptocurrency marketing method. To provide potential investors and cryptocurrency enthusiasts with token information, token teams regularly distribute unknown tokens to the accounts of cryptocurrency participants. The quantity is proportional to the original token quantity; to receive more airdrops, one must purchase more tokens. This is a very effective marketing method.
4. What is "candy"? When various cryptocurrencies are first issued and are in the ICO stage, the cryptocurrency is distributed to users for free. This is a way for the issuer of the virtual currency project to create hype and promote the project itself.
5. What does "breaking the issue price" mean? "Issuance price" refers to the initial offering price of a cryptocurrency. "Breaking the issue price" means that the price of a cryptocurrency has fallen below its initial offering price.
6. What does private placement mean? It's a way to invest in cryptocurrency projects and the best way for cryptocurrency project founders to raise funds for platform operations. Private placement is the opposite of public offering; simply put, it means raising funds privately. It refers to selling shares (cryptocurrencies) to a small group of qualified investors without going through the public market, thereby raising funds.
7. What does ICO mean? Initial Coin Offering, originating from the concept of Initial Public Offering (IPO) in the stock market, is a financing activity in which a blockchain project exchanges its own issued virtual currency for commonly used virtual currencies in the market.
8. What are the current cryptocurrency trading platforms? Binance, OKEx, Poloniex, Bittrex, Bitfinex, Kraken, Huobi Pro, Gate, etc. 1. Basic characteristics of cryptocurrency trading: (1) Trading hours: 7*24 hours, no market closures throughout the year. (2) No price limits: Cryptocurrency trading has no price limits, while stocks have price limits. For example, Bitcoin's single-day increase exceeded 20% on May 28. (3) Trading unit: The minimum purchase is 0.0001 BTC (approximately 0.6 yuan). There is no minimum purchase limit of one lot (100 shares) for stocks. (4) Trading anytime: That is, T+0. Stocks are T+1 trading, meaning that stocks bought on the same day can only be sold on the next trading day. Cryptocurrencies are T+0 trading, meaning that they can be bought and sold on the same day. (5) No time limit for withdrawal and cashing out: You can withdraw and cash out at any time, with high liquidity.
9. Wallet Concept: Simply put, a wallet is like a personal bank card. If you're not comfortable storing your cryptocurrency on a trading platform, you can store it in your personal wallet. There are various types of wallets: some are dedicated to a single currency, such as wallets that can only store EOS; others can store multiple currencies, such as imToken and Tokenpocket (TP wallet for short). The latter is more widely used.
10. Positive/Negative News: News that stimulates price increases is called positive news. Conversely, news that causes cryptocurrency prices to fall is called negative news, such as hacking of trading platforms and the theft of Bitcoin, or government crackdowns.
12. Rebound / Consolidation / Pullback: In a general downtrend, occasional price increases in cryptocurrencies are called rebounds, with the increase being less than the decrease. Pullbacks, on the other hand, are temporary declines within an overall uptrend. Consolidation refers to a relatively stable price with minimal fluctuations. 1. Arbitrage: This refers to transferring the same cryptocurrency from a lower-priced trading platform to a higher-priced one, profiting from the price difference.
13. Leverage. Leveraged trading, as the name suggests, involves using a small amount of capital to invest several times the original capital, hoping to obtain a return several times the relative volatility of the investment target, or even incur losses. It is somewhat similar to gambling.
14. Basic Principles of Cryptocurrency Transactions
(1) Market Orders: Market orders are executed at the current market price, which to some extent guarantees that investors' buy and sell orders will be executed in a timely manner. However, investors cannot predict the transaction price before placing a market order, which introduces a certain degree of uncertainty. Generally speaking, the more volatile the market, the greater the uncertainty risk of the transaction price in market orders.
(2) Limit Orders: Investors can set a buy price lower than the market price or a sell price higher than the market price. The order will be executed when the market price moves to the set price. However, if the set price deviates significantly from the market price, the order may fail to execute.
(3) Basic principles of transaction: "price priority, time priority" principle. Higher buy price is preferred to be executed at a lower buy price, and lower sell price is preferred to be executed at a higher sell price. When the order prices are the same, the order placed earlier is preferred to be executed at a later time.
15. Detailed Explanation of Common Technical Terms Used in Trading
Turnover rate refers to the frequency of trading of a particular cryptocurrency within a certain period of time, and is one of the main indicators for evaluating the liquidity of a cryptocurrency.
Market orders are transactions that buy or sell at the current price. Market orders have priority; you can use a market order if you want to complete your transaction faster.
【Limit order】This is a transaction that buys or sells at a specified price; it is also called a limit order or pending order.
"Wash trading" is a trading technique used by market makers. The specific method involves opening accounts on multiple exchanges simultaneously and then trading back and forth between them in a tug-of-war fashion to manipulate the price of a cryptocurrency.
"Washout" is a tactic used by market makers to manipulate cryptocurrency prices, deliberately suppressing them. Specifically, they first raise the price and then sell off their holdings for profit. During this process, major players often intentionally place large sell orders to force low-priced buyers to sell their cryptocurrency, thus reducing upward pressure and making it easier to drive the price up.
[Market Support] When prices are low and a coin lacks popularity, large investors buy large quantities of the coin to prevent its price from falling further.
A bull market refers to a market characterized by widespread price increases, a sustained upward trend, and an optimistic outlook. (In the cryptocurrency market, this primarily refers to the rise of Bitcoin (BTC) leading to the rise of other major cryptocurrencies and altcoins.)
A bear market, the opposite of a bull market, refers to a sustained decline in market prices, characterized by low market sentiment and a continuous downward trend. (You are currently experiencing a bear market. In this phase, the most important thing is to survive. Then comes further action, such as accumulating cryptocurrency or buying on dips.)
【Monkey Market】I believe many people don't understand this, but it exists in the stock market. Why is it called a monkey market? Monkeys like to jump around, which corresponds to the volatile nature of our market. During a monkey market, the market is difficult to predict. (Main sectors might rise today and fall tomorrow; some altcoins might rise while others plummet.)
The term "main upward wave" originates from Elliott Wave Theory and refers to the longest-lasting upward wave in a market trend. This is a common occurrence in bull markets; catching the main upward wave can lead to substantial profits. Conversely, the opposite trend is sometimes called the "main downward wave."
【Slow Decline】The overall market trend is downward, but the trend often goes up for two days and down for one day, always giving people hope, but always disappointing them.
【Waterfall】 This refers to a sudden and sharp drop in the market price, with several large bearish candlesticks appearing in a short period of time, like a waterfall cascading down, causing pain and distress to those who witness it. It is also sometimes called a "dive."
[Explosive Rise] The market is affected by negative factors and remains sluggish for a long time. During this period, the market will be very depressed. Once the negative factors have been fully priced in or removed, the market will experience an explosive rise.
【Market Shakeout】 Large financial groups, such as market makers or project owners, manipulate the market through capital, causing prices to fluctuate and scare away hesitant investors, thereby reaping huge profits.
[Accumulation] Generally, the market maker will shake out retail investors by washing out their shares, and then take over the shares sold by retail investors, so that they have more shares and achieve the goal of controlling the market (accumulation operations are usually carried out at low prices).
[Market Control] It's simple: I have a lot of money (a large proportion of the circulating supply of cryptocurrency), so I can easily manipulate the market. The goal is simple: make more money and fleece more retail investors. [Harvesting Retail Investors] Some cryptocurrency traders lose money and leave, while newcomers enter, just like leeks, being harvested one after another. The happiest ones are the market makers.
【Deceptive Patterns】 Market makers use candlestick charts to create upward or downward price movements, inducing us to buy or sell, in order to achieve their goal of profiting from retail investors.
[Positive Factors] Also known as favorable news. It mainly utilizes news-related factors, often referring to positive news. Many people believe that positive news will definitely lead to a price increase, but this isn't always the case. Positive and negative news don't directly correlate with price increases; they only have a certain impact and may stimulate the market.
[Negative news] refers to news that is unfavorable to the market. However, there is also a saying in the market: once the negative news is fully priced in, it will become positive.
[Bull Trap] The price has been consolidating for a long time, and a decline is more likely. Most short sellers have already sold their cryptocurrencies. Suddenly, the short sellers push the price up, inducing long sellers to believe that the price will rise and buy in. As a result, the short sellers then suppress the price, trapping the long sellers. [Bear Trap] After buying cryptocurrencies, the long sellers deliberately suppress the price, making short sellers believe that the price will fall and sell in. They then fall into the long sellers' trap.
【Position】This is very simple: it's the ratio of your account funds to the funds you use to buy cryptocurrencies.
【All in】 This means all funds in the account have been invested in cryptocurrency. What you often refer to as "going all in" or "going all in" are both examples of using all your funds.
[Averaging down] For example, if you hold BTC and then BTC drops in price, you buy more BTC to lower your average cost.
【Adding to a Position】You hold BTC, are optimistic about its future development, and then buy more BTC during its upward trend. 【Establishing a Position】Also called opening a position. Refers to using account funds to purchase a certain amount of cryptocurrency.
[Reduce holdings] Due to anticipated risks in the market, some of the held cryptocurrencies have been sold.
[Lock-up] Those who trade futures with leverage should understand this. It's simple. If you're trading EOS futures with leverage, and you buy 10,000 units long, then open a 10,000 unit short position, think about it carefully and consider your entry points. [No Position] Not trading anymore, just watching. In the crypto world, this can be understood as: the account only holds USDT, no other coins. [Light Position] The funds invested in coins represent a very small percentage of the total capital. [Heavy Position] The funds invested in coins represent a very large percentage of the total capital. [Half Position] The funds invested in coins represent half of the total capital. [Clear Position] Stop trading, sell all coins, and prepare to stay out of the market.
[Profit Taking] After achieving a certain profit, sell all virtual currency to secure the gains.
[Stop Loss] Once losses reach a certain level, sell the held virtual currency to prevent further losses. [Sideways Trading] The market is not fluctuating much, with rises and falls revolving around a range.
[Rebound] When the price of a coin is falling, it may be supported by technical factors or by the intervention of funds, and the market may turn from falling to rising.
[Reversal] The price of a coin has bottomed out and can't fall any further, so it reverses its downward trend and starts to rise. A common type is the "V-shaped reversal." A rebound is the foundation of a reversal, but the magnitude of a reversal is much greater than a rebound. [Arbitrage] Simply put, it involves identifying price differences between platforms and profiting from those differences. The key to arbitrage is the transfer speed, as this can sometimes affect your profits.
【Over-the-Counter Trading】Many platforms also call this fiat currency trading. The platform acts as a guarantor, allowing merchants or individuals to directly trade using RMB, buying or selling their mainstream cryptocurrencies or USDT. The trading is similar to Taobao (you know what I mean). 【Cutting Losses】A more polite term is "stop-loss." This is something some of you often do: sell even when the price drops, fearing it will fall even further.
【Being Trapped】If you buy cryptocurrency and the price drops, and you can't bear to sell, congratulations, this is called being trapped.
[Getting Out of a Loss] The cryptocurrency you bought dropped in price, and you were heartbroken. After a while, it rebounded, and you broke even, making you happy again.
【Missing out】When the market is down, you buy. When the market rallies, you wait and see. You perfectly miss out; that's called missing out.
[Roller Coaster] The cryptocurrency you bought went up, you were excited and even bragged to your friends, but a few days later it dropped back down. It was like riding a roller coaster; you got a thrill, and then nothing happened.
【Hoarding Coins】If you are optimistic about the future development of this coin and want to achieve financial freedom by making it tenfold, a hundredfold, or a thousandfold, then you buy a large amount of this coin and hoard it.
【Going Long】 Also known as "bullish", it means that the buyer believes the price of the coin will rise in the future, so they buy the coin and sell it at a higher price after the price rises.
Short selling, also known as "going short," is the opposite of going long. Sellers believe the price of a cryptocurrency will fall in the future, so they sell the cryptocurrency they hold (or borrow cryptocurrency from the trading platform), and then buy it back at a lower price to profit.
[Mining] The process of using computers, mobile phones, and other devices to run computing programs to obtain digital currency. Note: Mining will shorten the lifespan of your devices.
【ICO】Initial Coin Offering, originating from the concept of initial public offering (IPO) in the stock market, is a financing activity in which a blockchain project exchanges its own issued virtual currency for commonly used virtual currencies in the market.
[Private Funding Round] Private funding is in contrast to public funding. Public funding refers to the act of raising funds from a broad, unspecified group of people, such as funds sold by banks; while private funding targets a specific group of people and cannot be advertised publicly.
Giving roses leaves a lingering fragrance; thank you for your likes, follows, and shares! Wishing everyone financial freedom in 2025!
Welcome to follow Rongrong! You can watch live trading sessions, learn and exchange ideas, and gain a clear understanding of market direction and strategies. Knowing the market's style in advance allows you to better manage it!
There are still spots available in the team, hop on board quickly, and we'll help you become the house and the winner.

