

CRYPTO MECHANIC
9.9k Posts

CRYPTO MECHANIC
 Square Verified+
Report
Block User
Trading Crypto Since 2016 | X: @cryptomechanicX

2025 Blockchain 100 — Trader

Creator Awards 2024

Excellence Award (Trading)
4 Following
269.5K+ Followers
507.1K+ Liked
7 Badges
Posts
All
Quotes
Videos
Live
PINNED
I have a group of smart traders
Join us and be part of the community.👇
Tap here 👉🏻 [CM Circle](https://app.binance.com/uni-qr/ETFKakYX) 👈
The group is paid, but I’ve kept the fee very small at $9.99/month to keep the community serious and focused.
If you’re serious about trading and want to be around like minded traders, you’re welcome to join. 🤝
I have a group of smart traders
Join us and be part of the community.👇
Tap here 👉🏻 CM Circle 👈
The group is paid, but I’ve kept the fee very small at $9.99/month to keep the community serious and focused.
If you’re serious about trading and want to be around like minded traders, you’re welcome to join. 🤝
Join us and be part of the community.👇
Tap here 👉🏻 CM Circle 👈
The group is paid, but I’ve kept the fee very small at $9.99/month to keep the community serious and focused.
If you’re serious about trading and want to be around like minded traders, you’re welcome to join. 🤝
21
72
72k
$ENA fundamentals are getting better and better every day.
$ENA fundamentals are getting better and better every day.
9
44
7.3k
One of the biggest blunders you can make with your trades is changing a long-term position because of something you saw on social media.
You take a position based on a higher-timeframe thesis.
Then you see someone post a 1H or 4H chart showing a bearish setup
You start questioning your trade.
You panic.
And eventually, you sell your position.
Then a few days later, price does exactly what you originally
expected.
Don’t do this.
If your thesis is based on the higher timeframes, don’t let lower timeframe noise change your conviction.
And don’t let someone else’s opinion change your bias simply because they sound confident.
They may be looking at the exact same chart from a completely different perspective.
it should always be:
Your timeframe.
Your thesis.
Your plan.
Lower-timeframe price action can give you information, but it shouldn’t automatically invalidate a higher timeframe thesis.
Know why you entered.
Know what would invalidate your thesis.
And until that happens, stick to your plan.
One of the biggest blunders you can make with your trades is changing a long-term position because of something you saw on social media.
You take a position based on a higher-timeframe thesis.
Then you see someone post a 1H or 4H chart showing a bearish setup
You start questioning your trade.
You panic.
And eventually, you sell your position.
Then a few days later, price does exactly what you originally
expected.
Don’t do this.
If your thesis is based on the higher timeframes, don’t let lower timeframe noise change your conviction.
And don’t let someone else’s opinion change your bias simply because they sound confident.
They may be looking at the exact same chart from a completely different perspective.
it should always be:
Your timeframe.
Your thesis.
Your plan.
Lower-timeframe price action can give you information, but it shouldn’t automatically invalidate a higher timeframe thesis.
Know why you entered.
Know what would invalidate your thesis.
And until that happens, stick to your plan.
You take a position based on a higher-timeframe thesis.
Then you see someone post a 1H or 4H chart showing a bearish setup
You start questioning your trade.
You panic.
And eventually, you sell your position.
Then a few days later, price does exactly what you originally
expected.
Don’t do this.
If your thesis is based on the higher timeframes, don’t let lower timeframe noise change your conviction.
And don’t let someone else’s opinion change your bias simply because they sound confident.
They may be looking at the exact same chart from a completely different perspective.
it should always be:
Your timeframe.
Your thesis.
Your plan.
Lower-timeframe price action can give you information, but it shouldn’t automatically invalidate a higher timeframe thesis.
Know why you entered.
Know what would invalidate your thesis.
And until that happens, stick to your plan.
10
2
84
8.9k
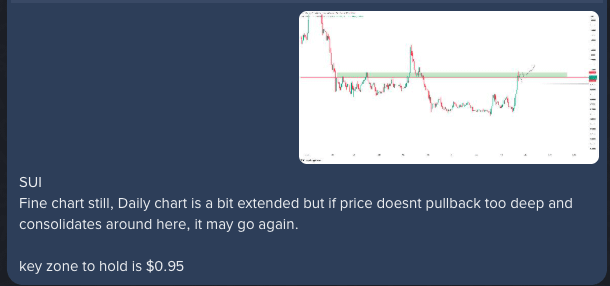
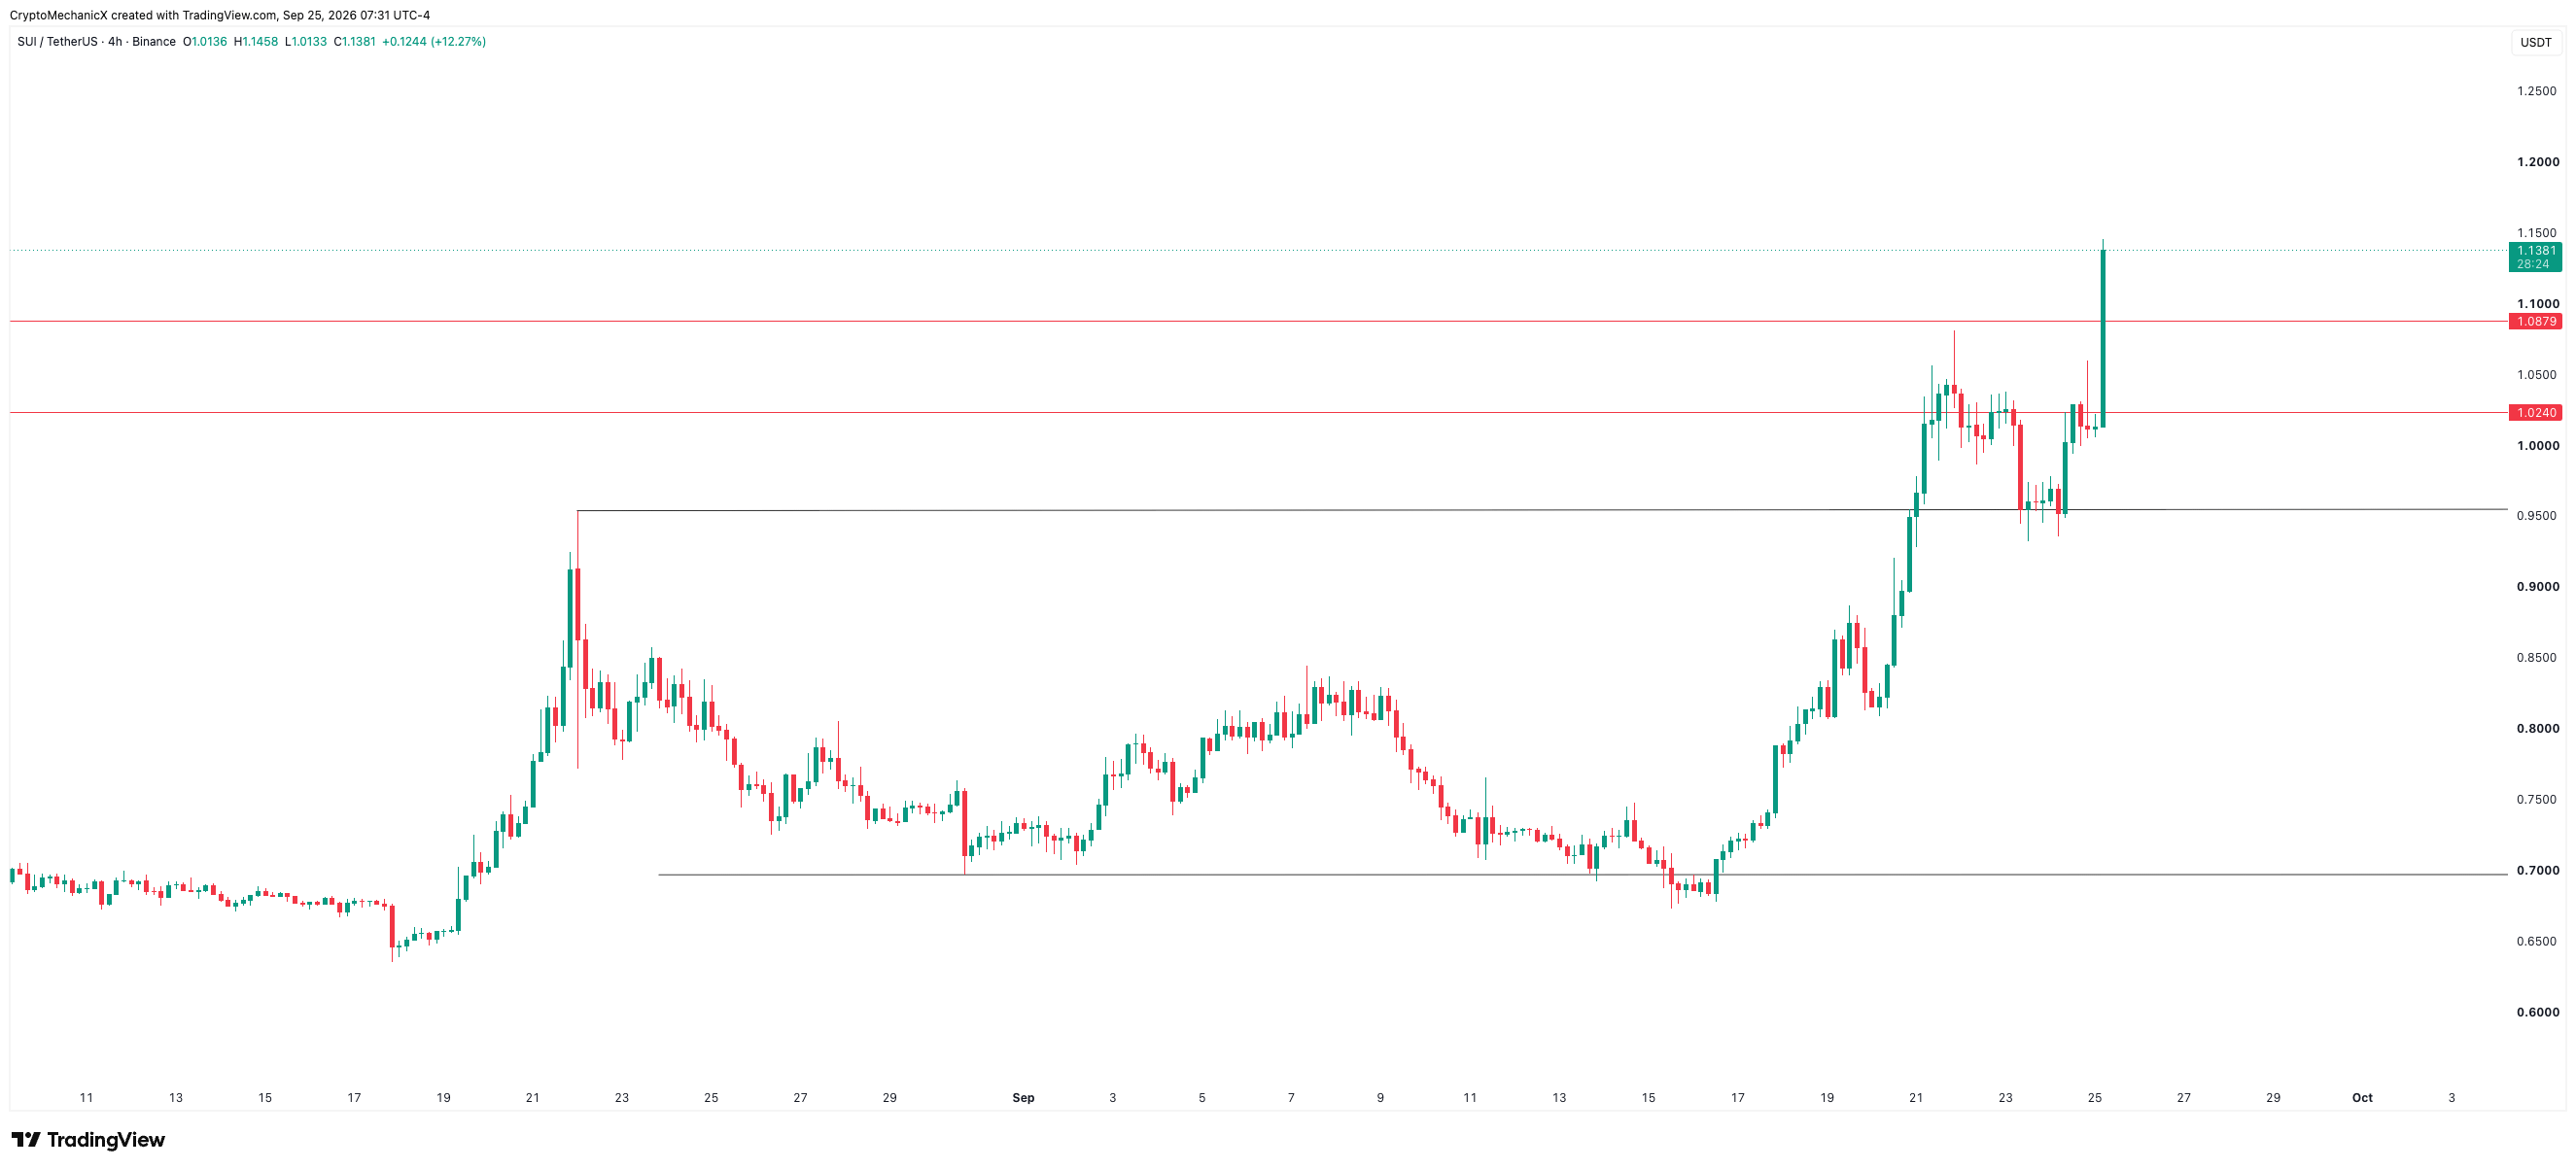
$SUI Setup played out pretty damn well.
Tapped $0.95 followed by a nice move up.
$SUI Setup played out pretty damn well.
Tapped $0.95 followed by a nice move up.
Tapped $0.95 followed by a nice move up.
15
37
11.5k
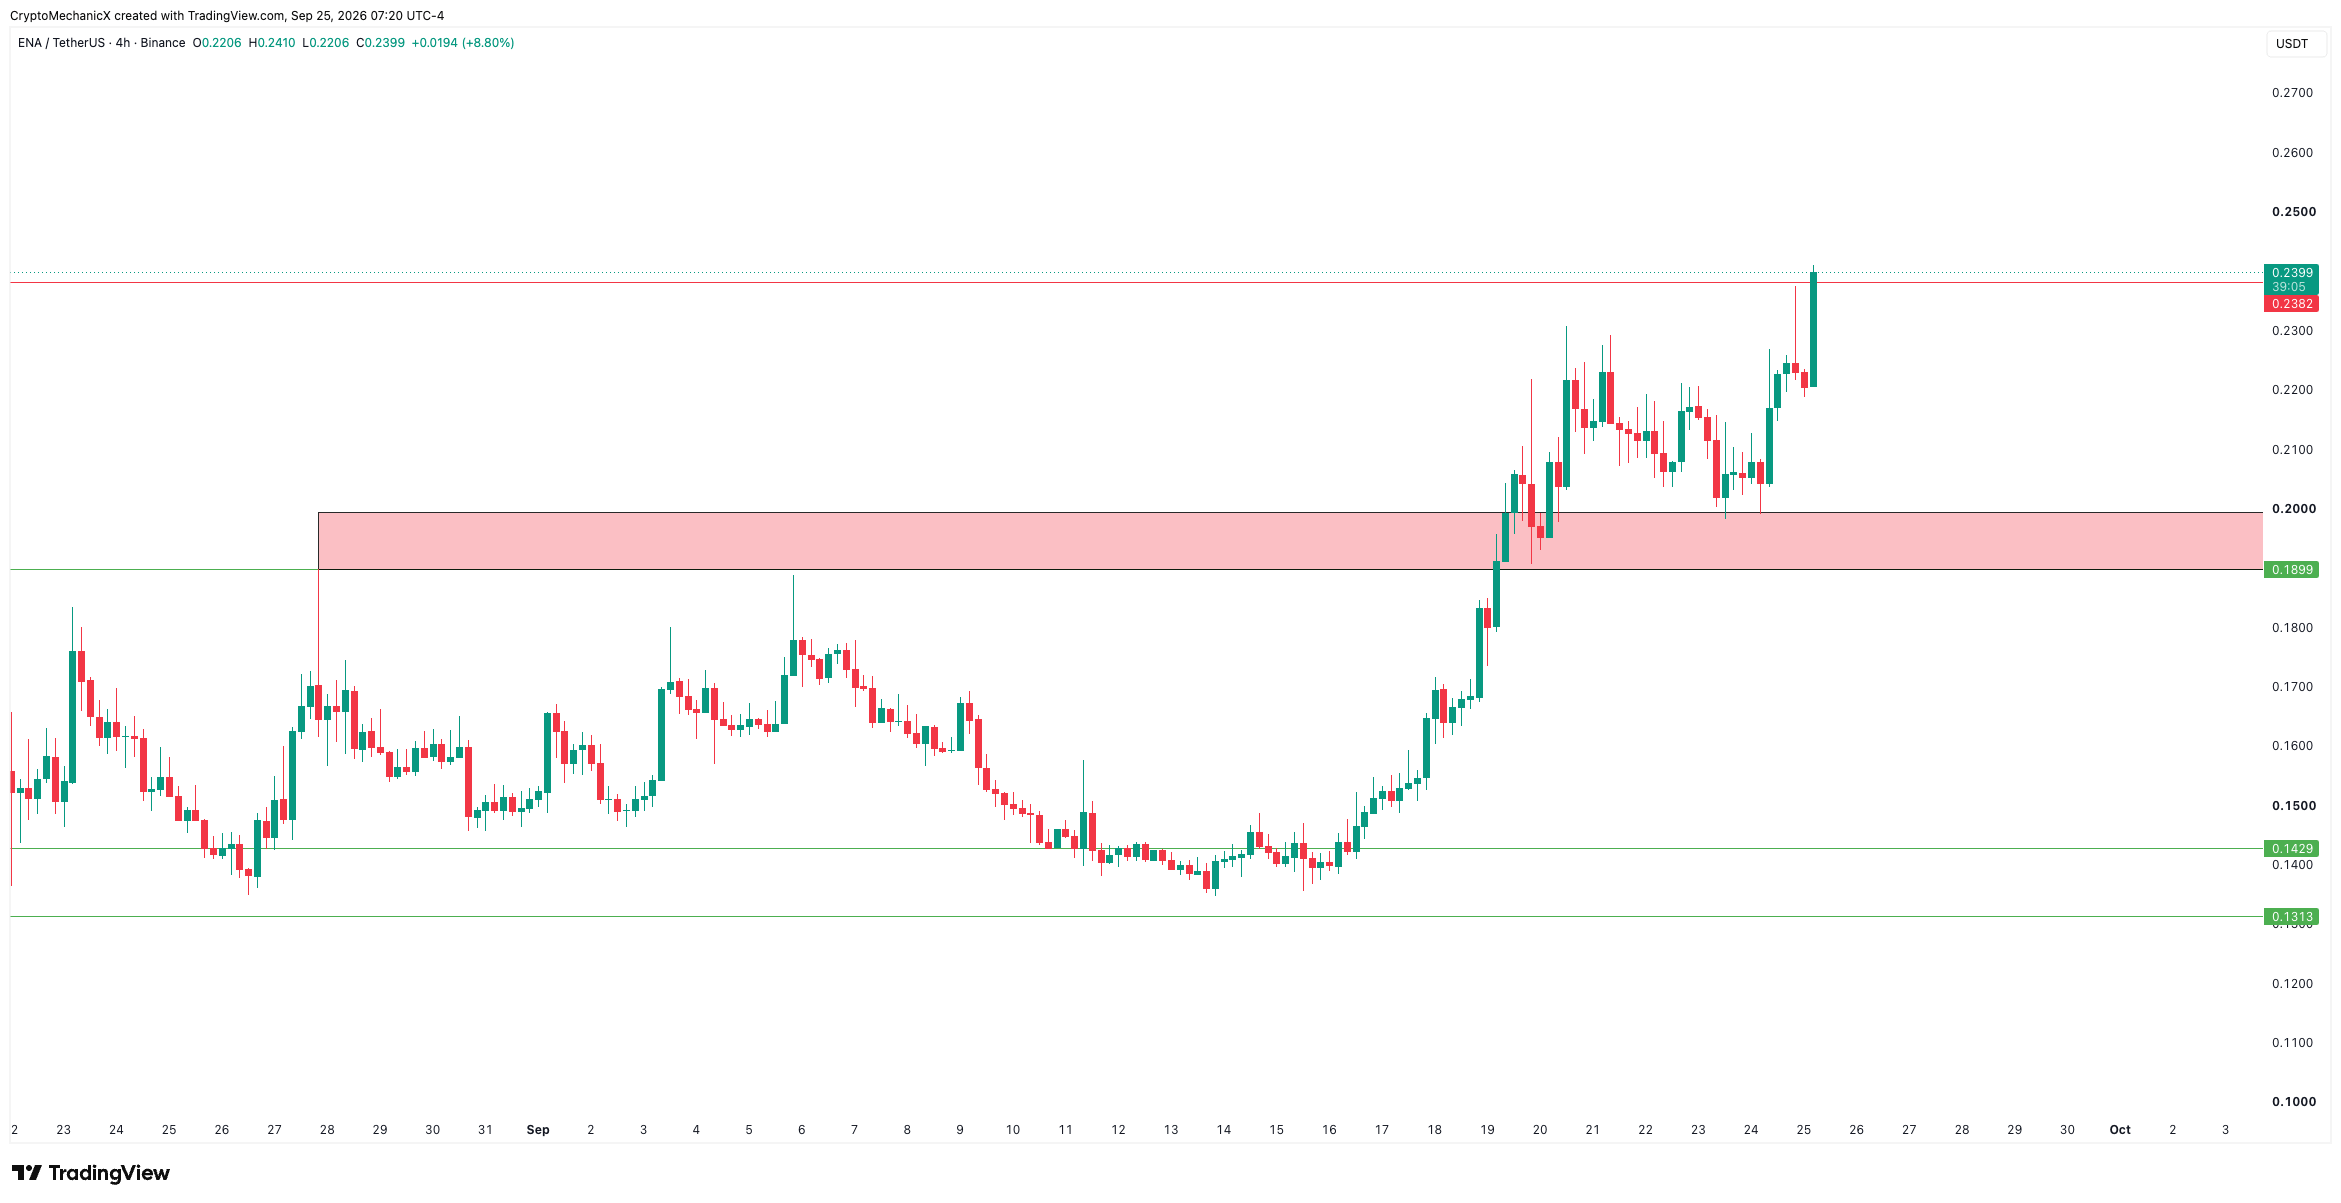
$ENA
Up 60% from entry.
Broke into new high, Love to see it.
$ENA
Up 60% from entry.
Broke into new high, Love to see it.
Up 60% from entry.
Broke into new high, Love to see it.
CRYPTO MECHANIC
·
--
$ENA Consolidating above the highs which is fine after a good move up.
Should not pullback too deep ideally it consolidate here and keep moving.
$0.12-0.14 is the key support, Above this i think it's bullish.
Should not pullback too deep ideally it consolidate here and keep moving.
$0.12-0.14 is the key support, Above this i think it's bullish.
5
34
7.9k
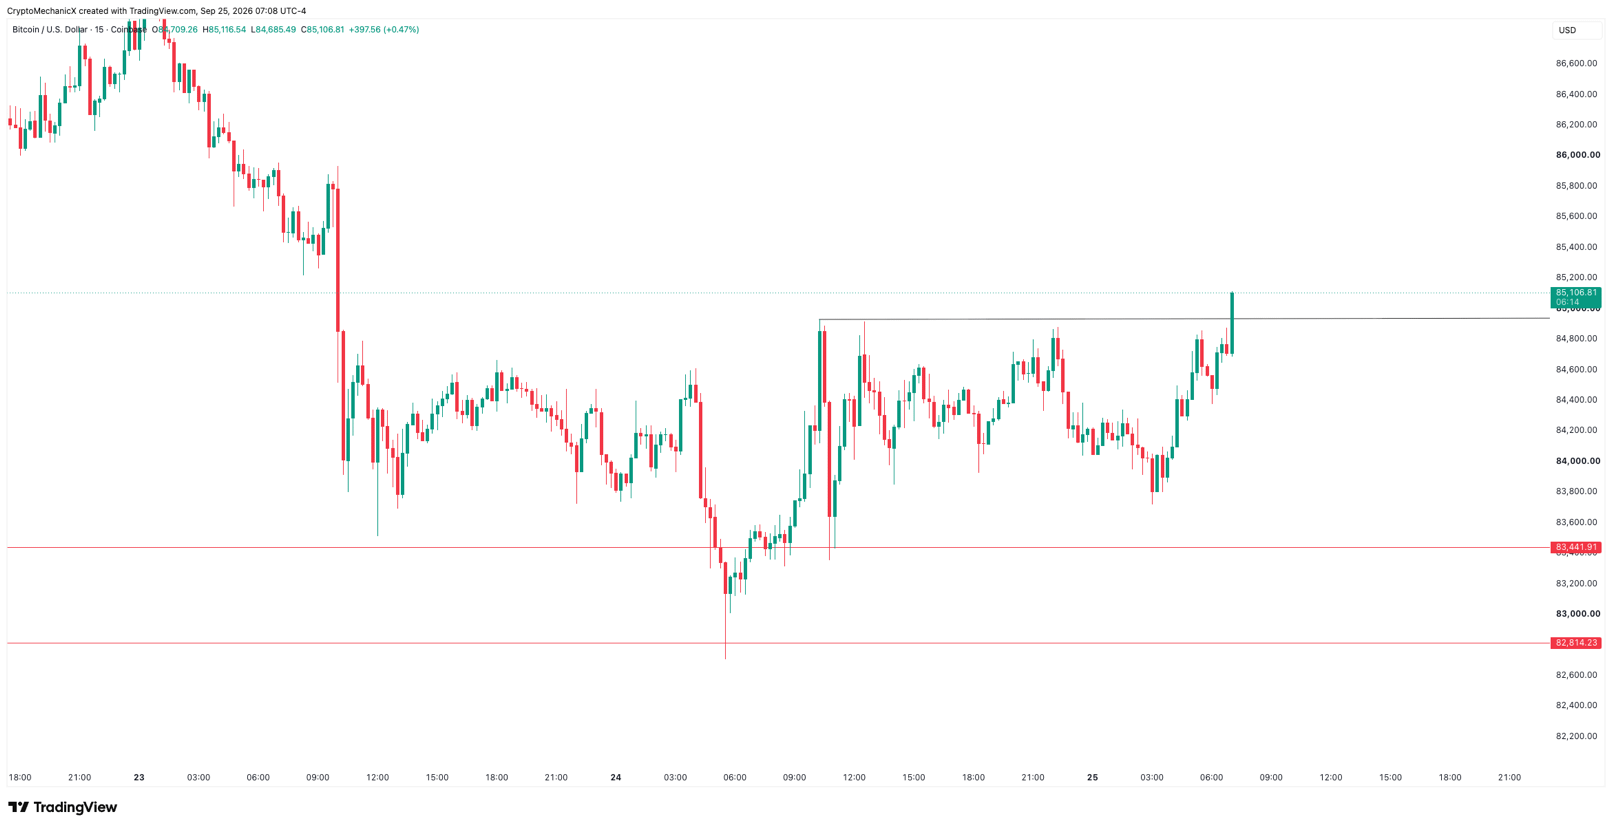
$BTC
Low $83k’s protected
Lower timeframe highs broken
Now continue sending it pls 🤝
$BTC
Low $83k’s protected
Lower timeframe highs broken
Now continue sending it pls 🤝
Low $83k’s protected
Lower timeframe highs broken
Now continue sending it pls 🤝
CRYPTO MECHANIC
·
--
$BTC
Price tapped that zone and bounced, followed by the rejection.
$82,800-ish is also the last swing high / lower high, which should ideally be protected in my opinion.
Price tapped that zone and bounced, followed by the rejection.
$82,800-ish is also the last swing high / lower high, which should ideally be protected in my opinion.
6
43
5.5k
When you open a high leverage trade, the only thing on your mind is usually:
“How much money will I make from this trade?”
And honestly, that’s a totally fine thought.
But you also need to think about it the other way:
If this trade goes against me, how much money can I lose? Can I actually bear that loss?
People only think about the “how much will I make?” part.
Then, when the trade starts going against them, they start to freak out.
Think about the risk before you enter the trade, not after.
When you open a high leverage trade, the only thing on your mind is usually:
“How much money will I make from this trade?”
And honestly, that’s a totally fine thought.
But you also need to think about it the other way:
If this trade goes against me, how much money can I lose? Can I actually bear that loss?
People only think about the “how much will I make?” part.
Then, when the trade starts going against them, they start to freak out.
Think about the risk before you enter the trade, not after.
“How much money will I make from this trade?”
And honestly, that’s a totally fine thought.
But you also need to think about it the other way:
If this trade goes against me, how much money can I lose? Can I actually bear that loss?
People only think about the “how much will I make?” part.
Then, when the trade starts going against them, they start to freak out.
Think about the risk before you enter the trade, not after.
26
2
170
93.2k
What is your end of the week target on $BTC ?
What is your end of the week target on $BTC ?
36
1
44
9.5k
$BTC
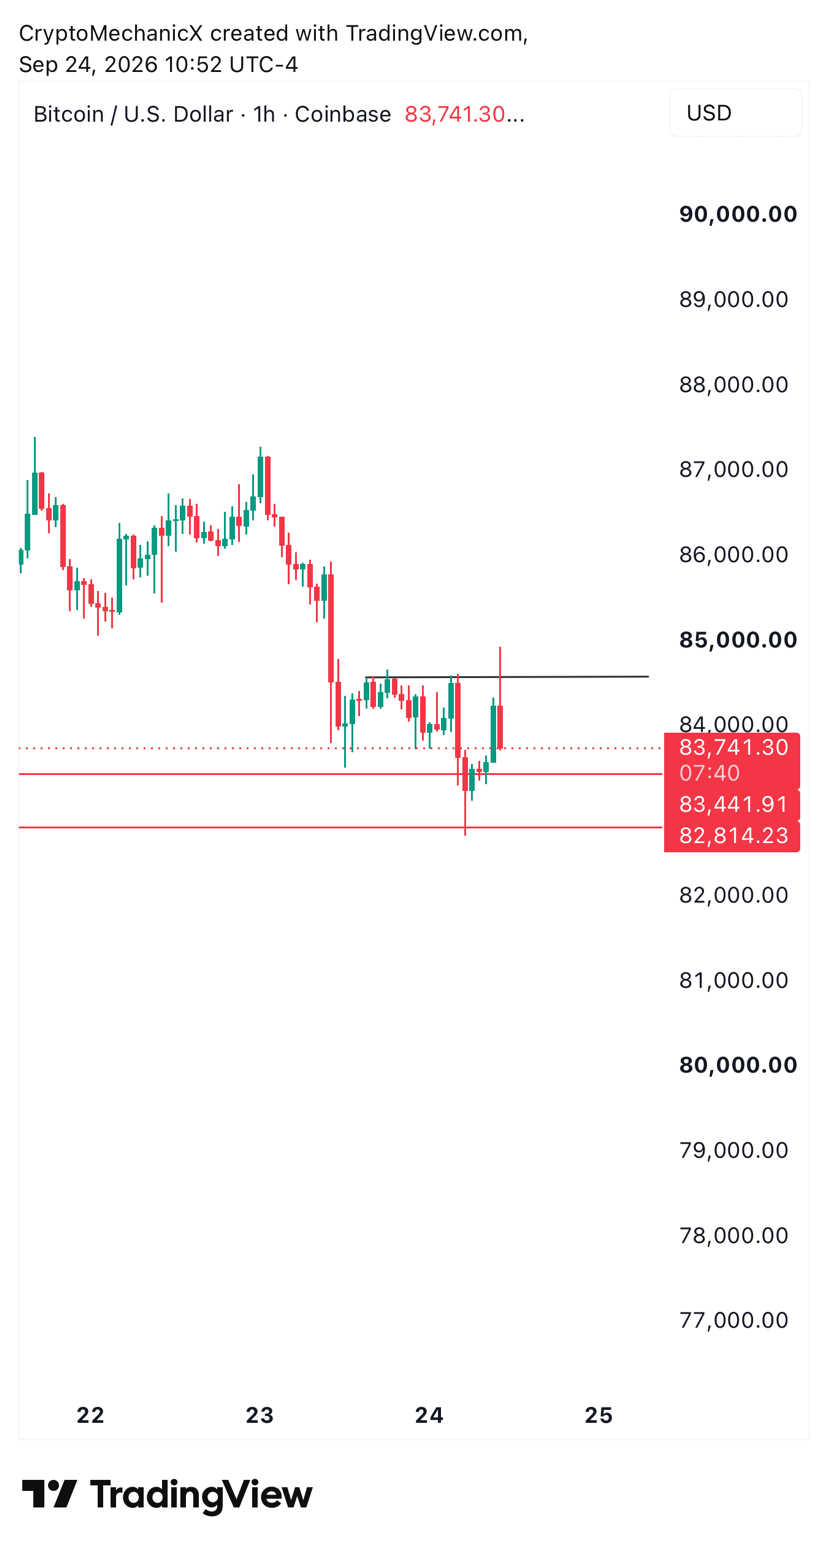
Price tapped that zone and bounced, followed by the rejection.
$82,800-ish is also the last swing high / lower high, which should ideally be protected in my opinion.
$BTC
Price tapped that zone and bounced, followed by the rejection.
$82,800-ish is also the last swing high / lower high, which should ideally be protected in my opinion.
Price tapped that zone and bounced, followed by the rejection.
$82,800-ish is also the last swing high / lower high, which should ideally be protected in my opinion.
CRYPTO MECHANIC
·
--
$BTC
Shouldn’t really pull back too deep here. Ideally, we find some support around the $83,500–$84,000 zone.
We had a high-timeframe breakout this week.
Generally, you wouldn’t want to see price trade above an important HTF level, only for the breakout to be short-lived and price to drop back below it again.
If that happens, then yeah things become very fascinating.
Shouldn’t really pull back too deep here. Ideally, we find some support around the $83,500–$84,000 zone.
We had a high-timeframe breakout this week.
Generally, you wouldn’t want to see price trade above an important HTF level, only for the breakout to be short-lived and price to drop back below it again.
If that happens, then yeah things become very fascinating.
9
1
52
10.4k
$BTC
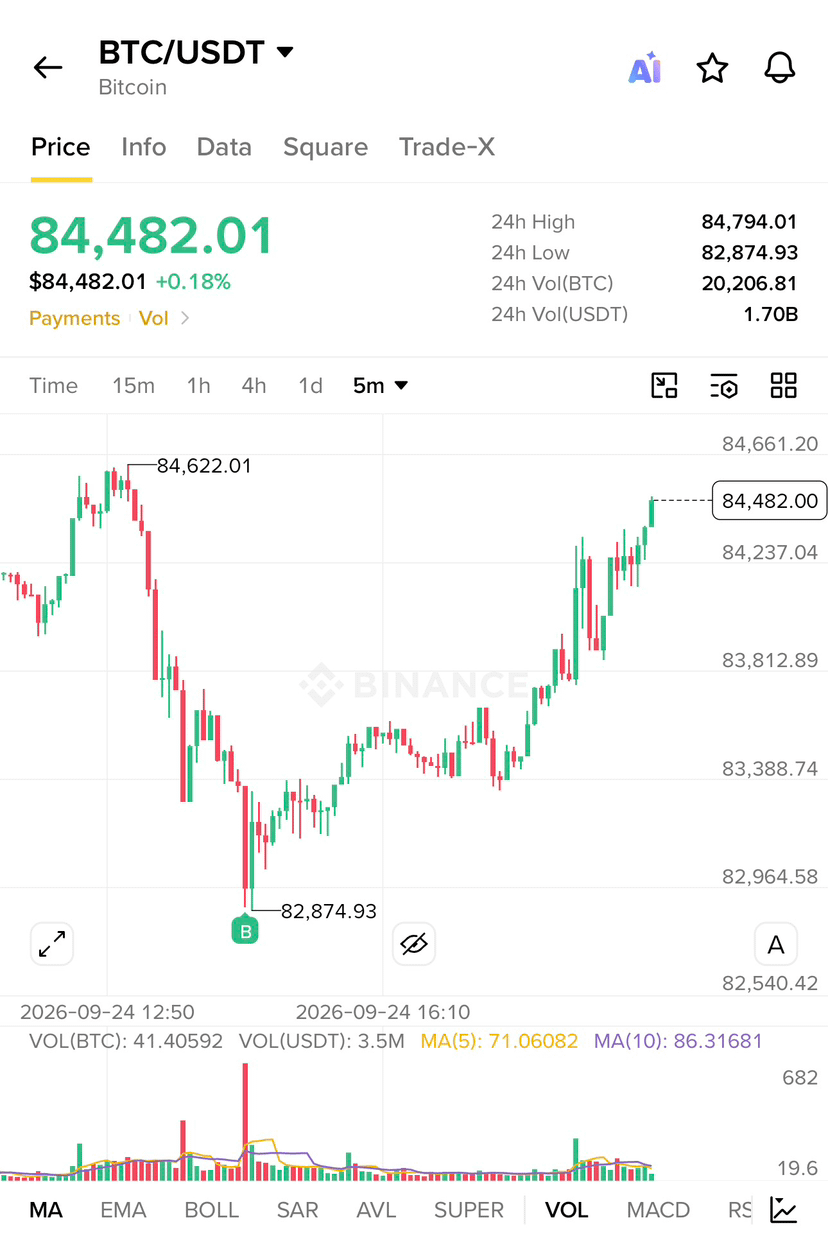
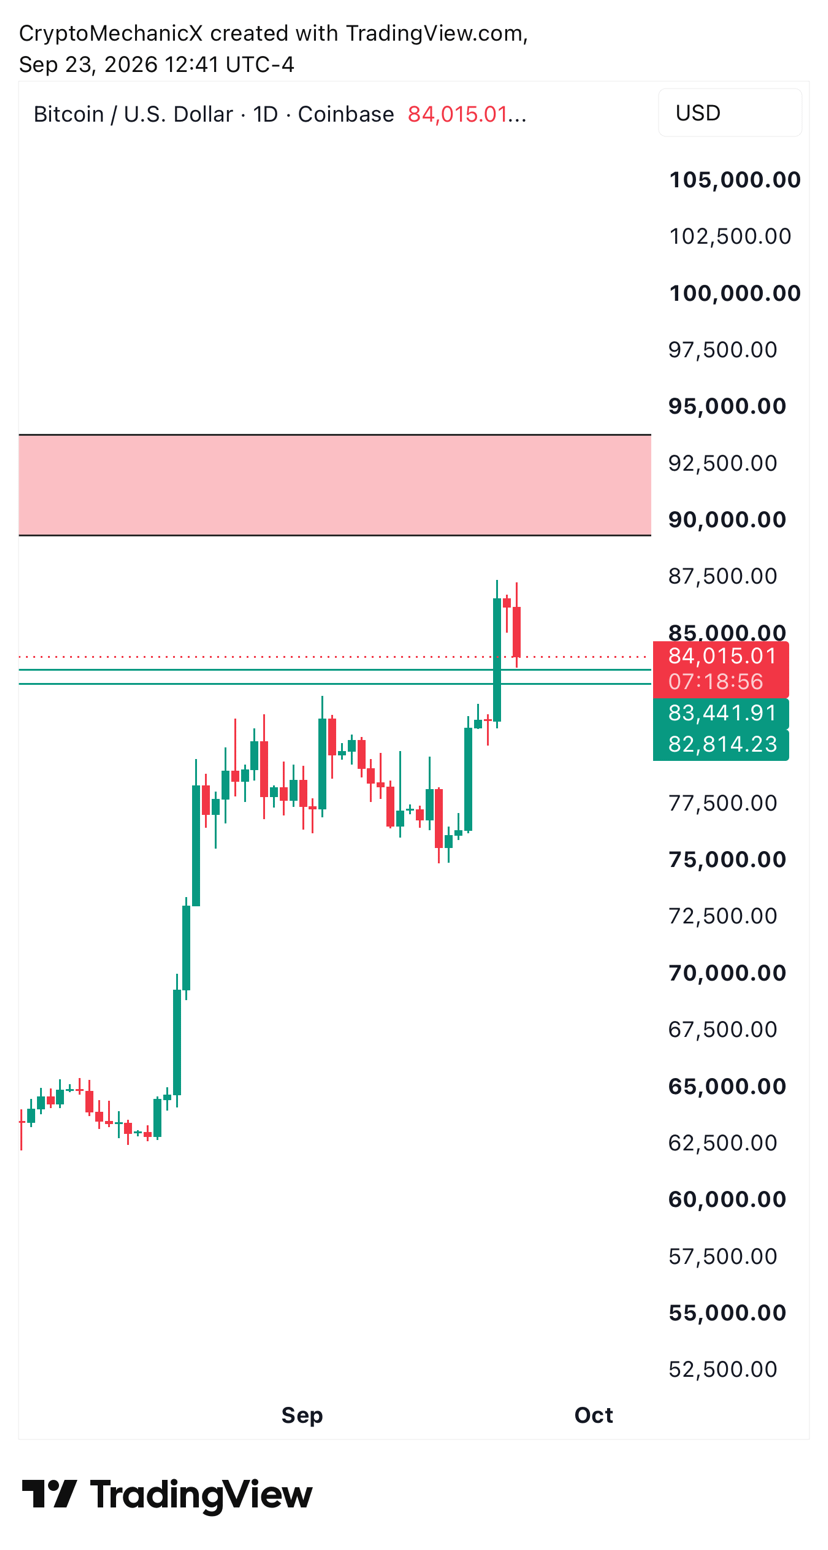
Shouldn’t really pull back too deep here. Ideally, we find some support around the $83,500–$84,000 zone.
We had a high-timeframe breakout this week.
Generally, you wouldn’t want to see price trade above an important HTF level, only for the breakout to be short-lived and price to drop back below it again.
If that happens, then yeah things become very fascinating.
$BTC
Shouldn’t really pull back too deep here. Ideally, we find some support around the $83,500–$84,000 zone.
We had a high-timeframe breakout this week.
Generally, you wouldn’t want to see price trade above an important HTF level, only for the breakout to be short-lived and price to drop back below it again.
If that happens, then yeah things become very fascinating.
Shouldn’t really pull back too deep here. Ideally, we find some support around the $83,500–$84,000 zone.
We had a high-timeframe breakout this week.
Generally, you wouldn’t want to see price trade above an important HTF level, only for the breakout to be short-lived and price to drop back below it again.
If that happens, then yeah things become very fascinating.
21
5
112
96.9k
Don’t let social media cloud your vision.
Don’t let it make you feel upset, make you feel like you missed it, or make you think the opportunity is already gone.
Do your best, put your blinders on, and focus on ONE thing:
Getting an allocation you’re comfortable with.
A lot of people will tell you:
“You missed the bottom.”
“You should have bought earlier.”
“Now it’s too late.”
Blah blah blah.
Let me show you something.
You missed nothing.
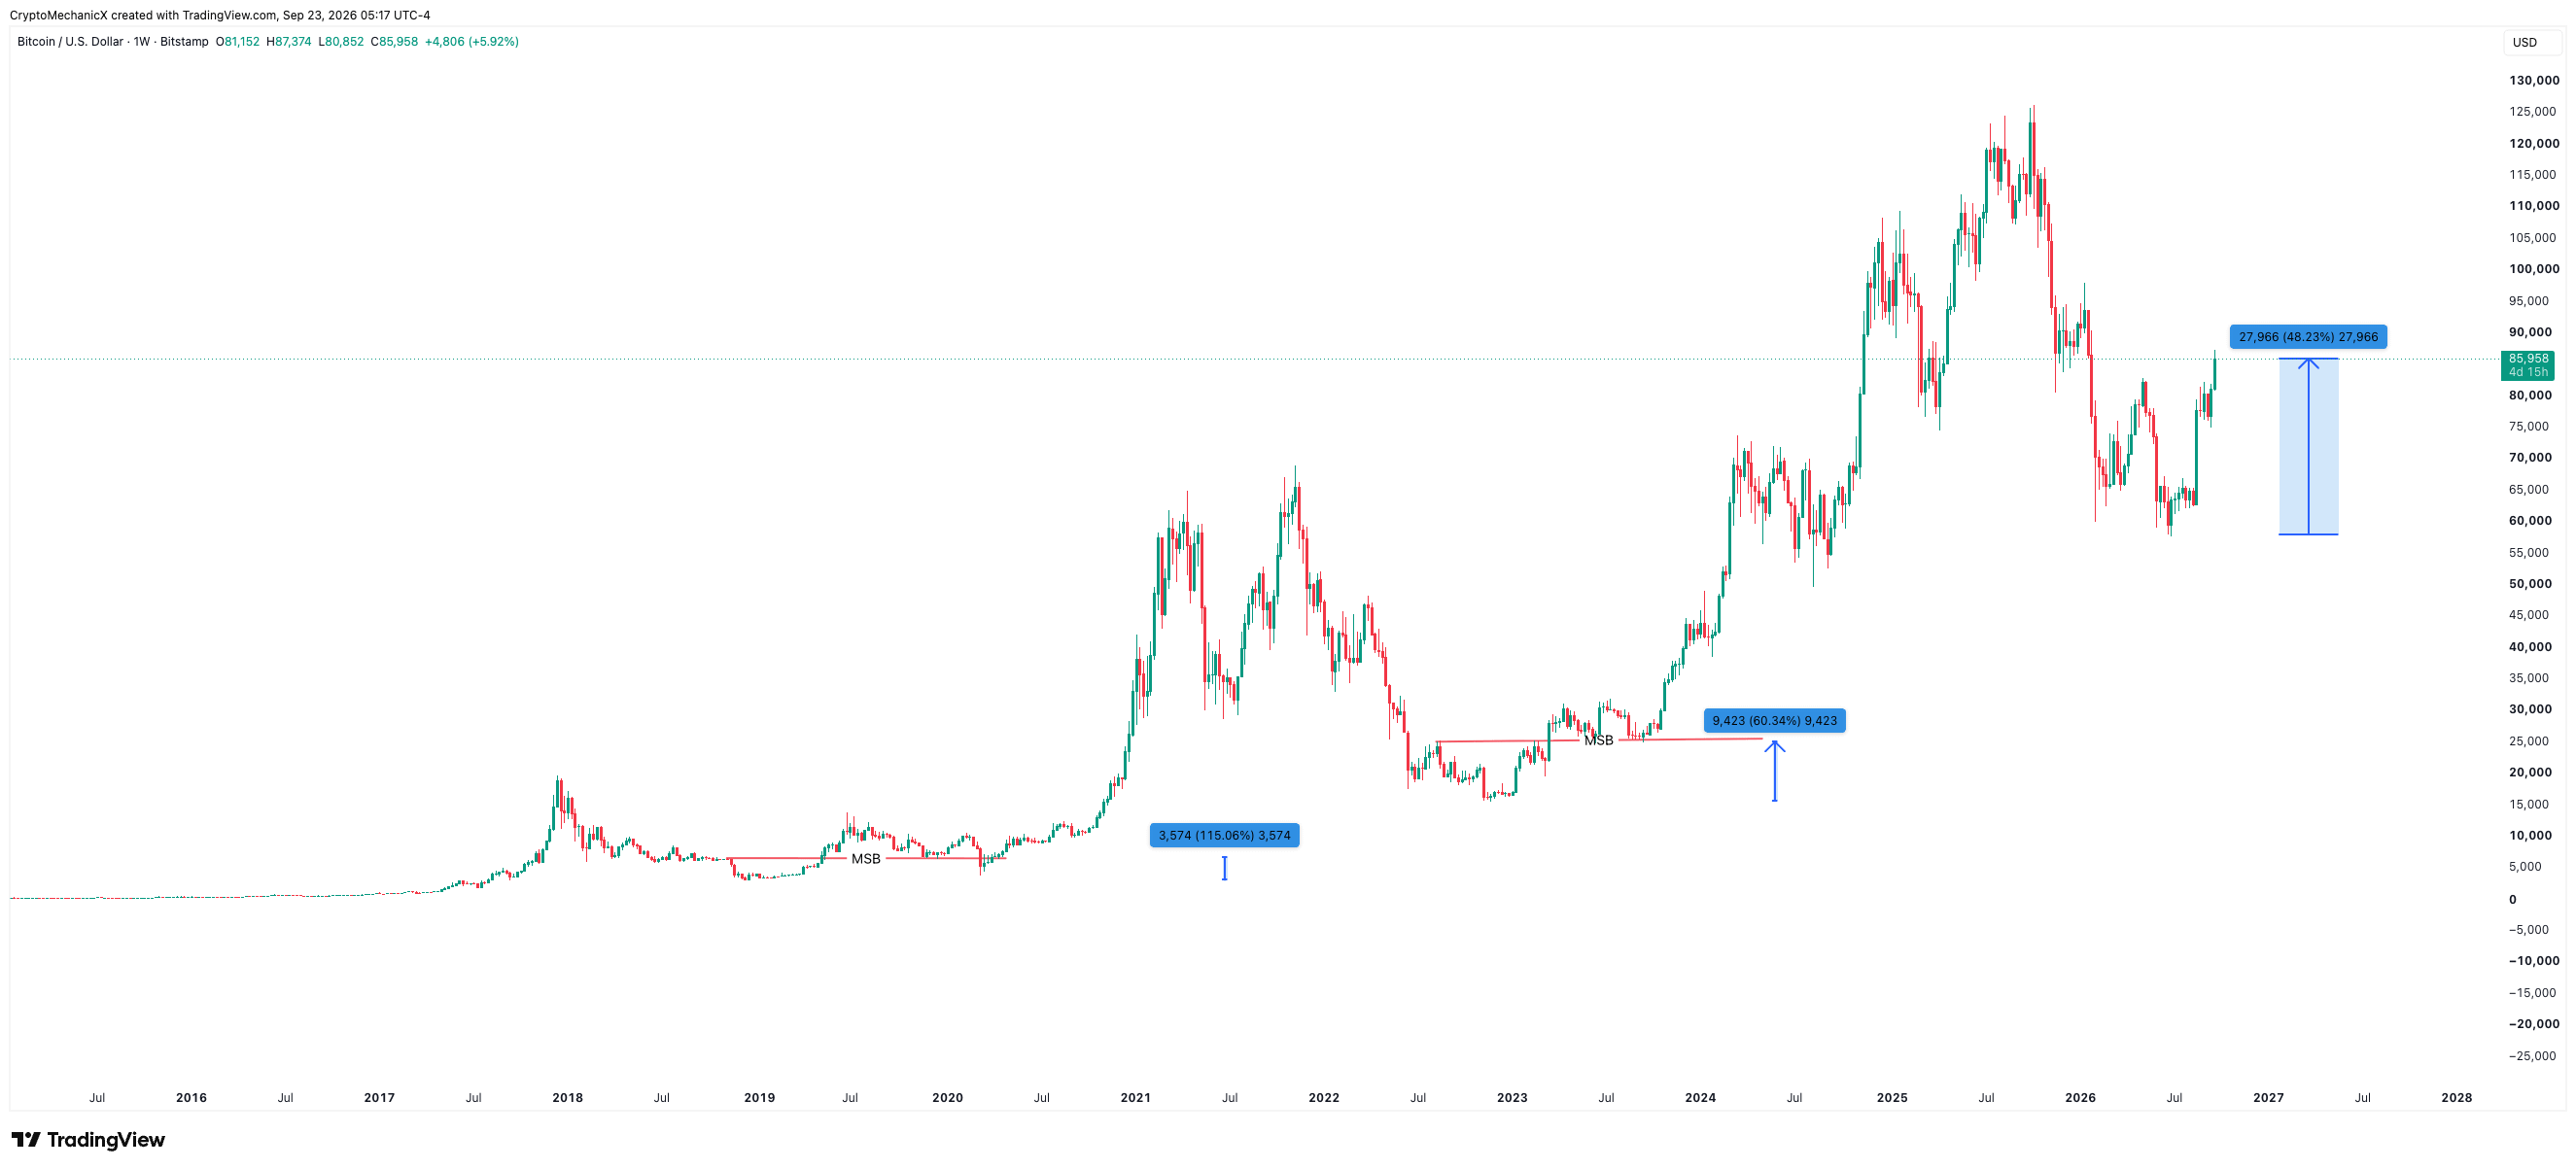
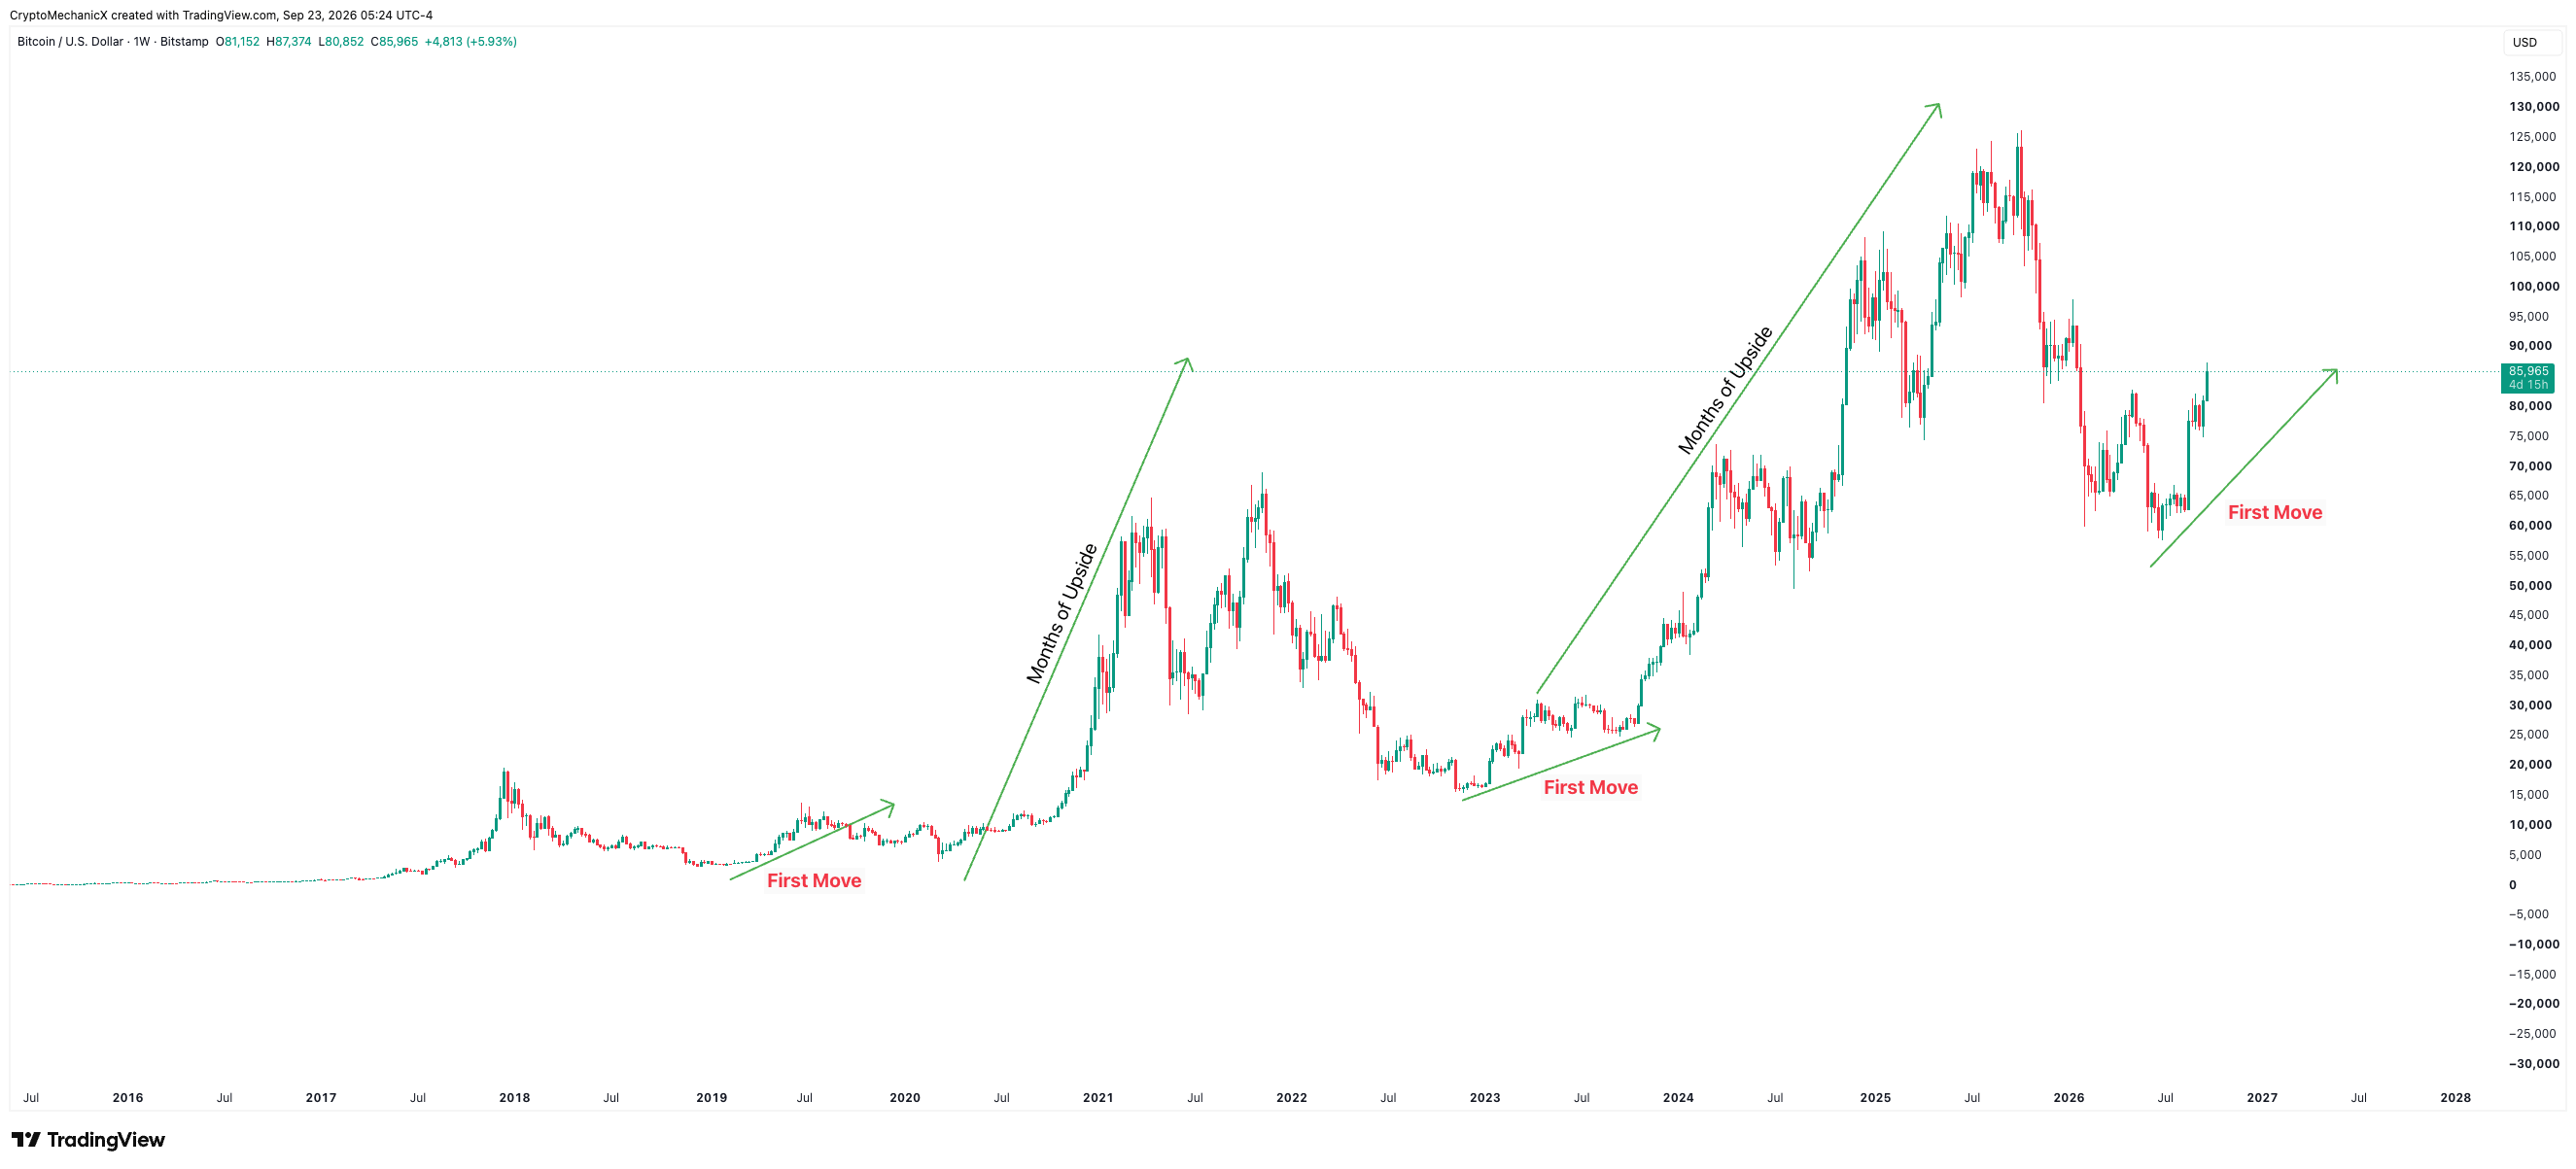
Look at Bitcoin’s previous higher-timeframe structure shifts
2018: BTC shifted its structure after roughly a 115% move.
What happened after that?
Another major expansion of around 900%.
2023: BTC shifted its structure after roughly a 60% move.
What happened after that?
Another major expansion of around 400%.
2026: BTC has shifted its structure after roughly a 45% move.
So what changed?
Nothing.
This is only the first leg.
Bitcoin is shifting its structure on the higher timeframes. I’m not saying history has to repeat exactly the same way, but the point is simple:
Don’t let one initial move convince you that the entire opportunity is gone.
Are you going to cry about the first move?
Or are you going to position yourself for what could come over the next few months?
You don’t need to chase price.
Ignore everyone telling you that you’ve missed it.
Open the chart.
Identify the key zones.
Plan where you’re willing to start allocating capital if the market gives you discounts.
I’ve talked about position sizing many times.
Position yourself slowly and deliberately.
There is no perfect price.
You need a good plan and good execution.
That’s what matters.
Don’t let social media cloud your vision.
Don’t let it make you feel upset, make you feel like you missed it, or make you think the opportunity is already gone.
Do your best, put your blinders on, and focus on ONE thing:
Getting an allocation you’re comfortable with.
A lot of people will tell you:
“You missed the bottom.”
“You should have bought earlier.”
“Now it’s too late.”
Blah blah blah.
Let me show you something.
You missed nothing.
Look at Bitcoin’s previous higher-timeframe structure shifts
2018: BTC shifted its structure after roughly a 115% move.
What happened after that?
Another major expansion of around 900%.
2023: BTC shifted its structure after roughly a 60% move.
What happened after that?
Another major expansion of around 400%.
2026: BTC has shifted its structure after roughly a 45% move.
So what changed?
Nothing.
This is only the first leg.
Bitcoin is shifting its structure on the higher timeframes. I’m not saying history has to repeat exactly the same way, but the point is simple:
Don’t let one initial move convince you that the entire opportunity is gone.
Are you going to cry about the first move?
Or are you going to position yourself for what could come over the next few months?
You don’t need to chase price.
Ignore everyone telling you that you’ve missed it.
Open the chart.
Identify the key zones.
Plan where you’re willing to start allocating capital if the market gives you discounts.
I’ve talked about position sizing many times.
Position yourself slowly and deliberately.
There is no perfect price.
You need a good plan and good execution.
That’s what matters.
Don’t let it make you feel upset, make you feel like you missed it, or make you think the opportunity is already gone.
Do your best, put your blinders on, and focus on ONE thing:
Getting an allocation you’re comfortable with.
A lot of people will tell you:
“You missed the bottom.”
“You should have bought earlier.”
“Now it’s too late.”
Blah blah blah.
Let me show you something.
You missed nothing.
Look at Bitcoin’s previous higher-timeframe structure shifts
2018: BTC shifted its structure after roughly a 115% move.
What happened after that?
Another major expansion of around 900%.
2023: BTC shifted its structure after roughly a 60% move.
What happened after that?
Another major expansion of around 400%.
2026: BTC has shifted its structure after roughly a 45% move.
So what changed?
Nothing.
This is only the first leg.
Bitcoin is shifting its structure on the higher timeframes. I’m not saying history has to repeat exactly the same way, but the point is simple:
Don’t let one initial move convince you that the entire opportunity is gone.
Are you going to cry about the first move?
Or are you going to position yourself for what could come over the next few months?
You don’t need to chase price.
Ignore everyone telling you that you’ve missed it.
Open the chart.
Identify the key zones.
Plan where you’re willing to start allocating capital if the market gives you discounts.
I’ve talked about position sizing many times.
Position yourself slowly and deliberately.
There is no perfect price.
You need a good plan and good execution.
That’s what matters.
20
3
86
10.8k
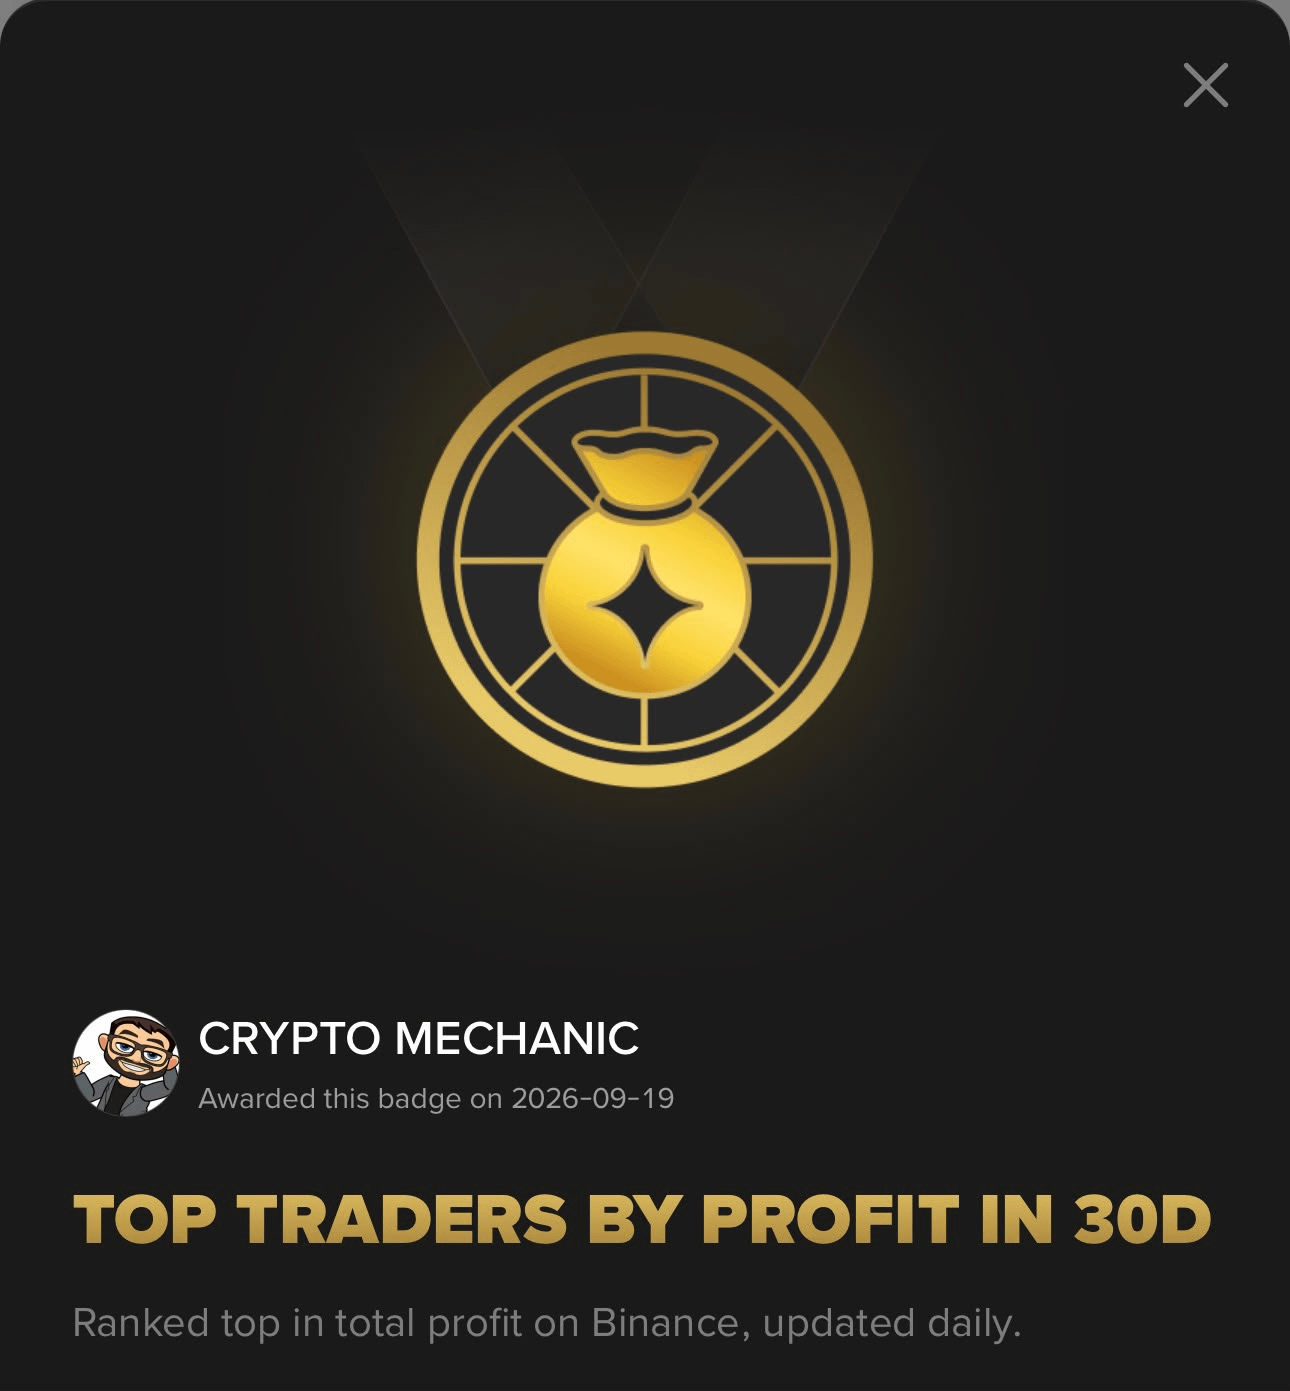
Top trader by profit in the last 30 days.
Not a signal provider.
Just a trader who trades.
Top trader by profit in the last 30 days.
Not a signal provider.
Just a trader who trades.
Not a signal provider.
Just a trader who trades.
66
245
118.9k
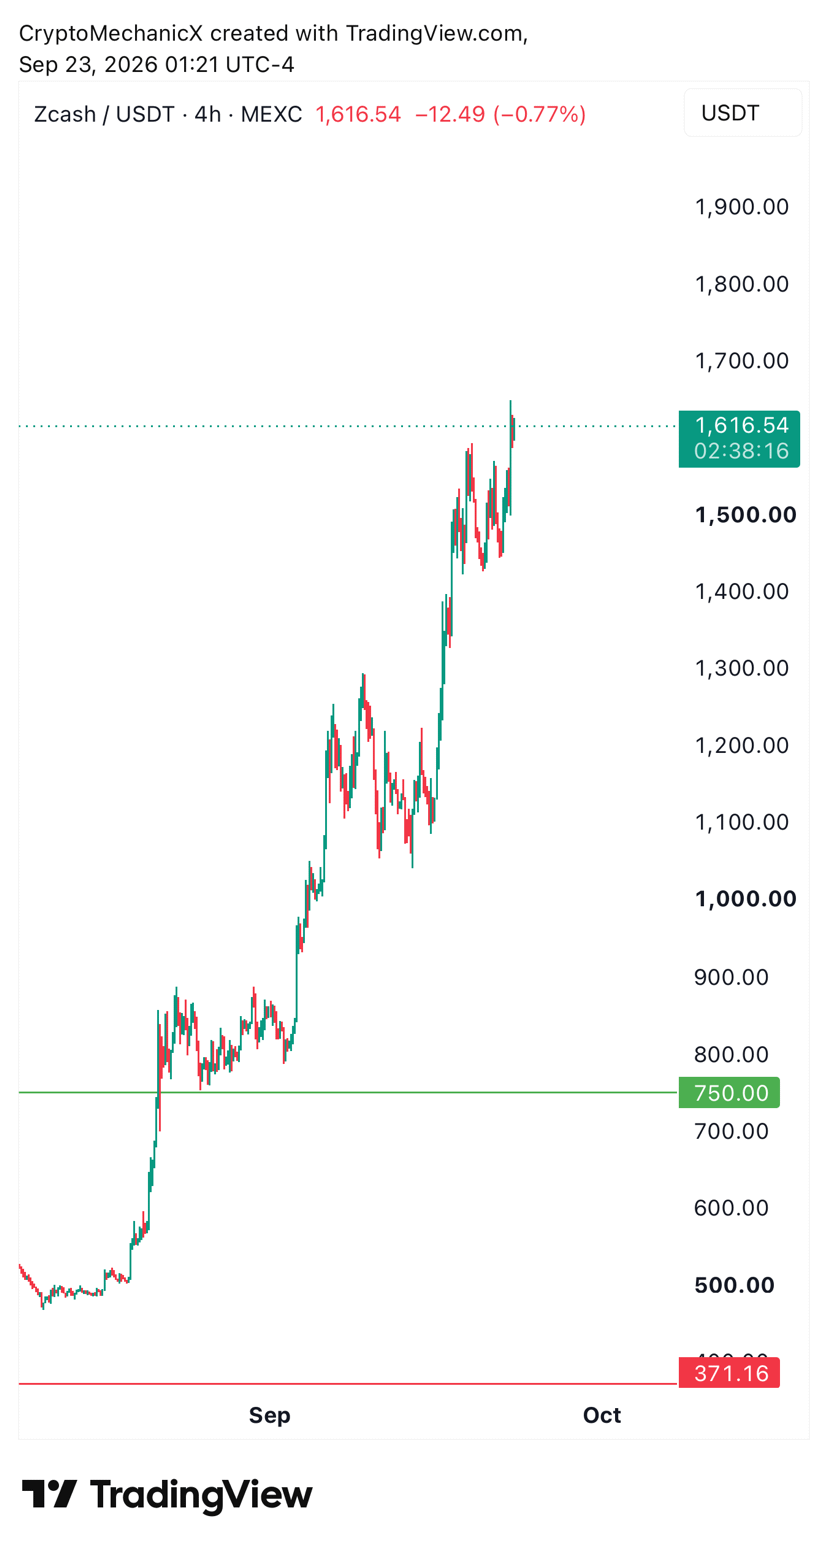
$ZEC is now up 2x from my Buy
I reduced a portion of my trade but still holding a good size, probably going to hold the rest for now.
$ZEC is now up 2x from my Buy
I reduced a portion of my trade but still holding a good size, probably going to hold the rest for now.
I reduced a portion of my trade but still holding a good size, probably going to hold the rest for now.
CRYPTO MECHANIC
·
--
This is the kind of chart that is worth your attention.
An all-time-high breakout.
You only need one line for your bias.
As long as price holds above that level, you expect the trend to continue higher.
Use lower timeframe for your entry triggers.
Could be:
A pullback
A sharp dip liquidating late buyers
A lower timeframe consolidation breakout
A lower timeframe sweep
There are multiple ways to trade a bullish chart.
You just need to plan it the right way.
An all-time-high breakout.
You only need one line for your bias.
As long as price holds above that level, you expect the trend to continue higher.
Use lower timeframe for your entry triggers.
Could be:
A pullback
A sharp dip liquidating late buyers
A lower timeframe consolidation breakout
A lower timeframe sweep
There are multiple ways to trade a bullish chart.
You just need to plan it the right way.
10
41
11.6k
If it’s too high, it’s not a buy.
But if the overall trend is bullish, it’s not a short either because you don’t know where the price will stop.
The better option is to wait for a good trade setup that gives you a better risk-to-reward ratio.
If it’s too high, it’s not a buy.
But if the overall trend is bullish, it’s not a short either because you don’t know where the price will stop.
The better option is to wait for a good trade setup that gives you a better risk-to-reward ratio.
But if the overall trend is bullish, it’s not a short either because you don’t know where the price will stop.
The better option is to wait for a good trade setup that gives you a better risk-to-reward ratio.
CRYPTO MECHANIC
·
--
When everyone is excited about a coin, talking about it, sharing their PnL cards, and you’re suddenly thinking:
“Ohhh… I should join them too and make some money.”
You’re LATE.
Find something else.
“Ohhh… I should join them too and make some money.”
You’re LATE.
Find something else.
7
60
9.1k
When everyone is excited about a coin, talking about it, sharing their PnL cards, and you’re suddenly thinking:
“Ohhh… I should join them too and make some money.”
You’re LATE.
Find something else.
When everyone is excited about a coin, talking about it, sharing their PnL cards, and you’re suddenly thinking:
“Ohhh… I should join them too and make some money.”
You’re LATE.
Find something else.
“Ohhh… I should join them too and make some money.”
You’re LATE.
Find something else.
22
5
136
74.7k
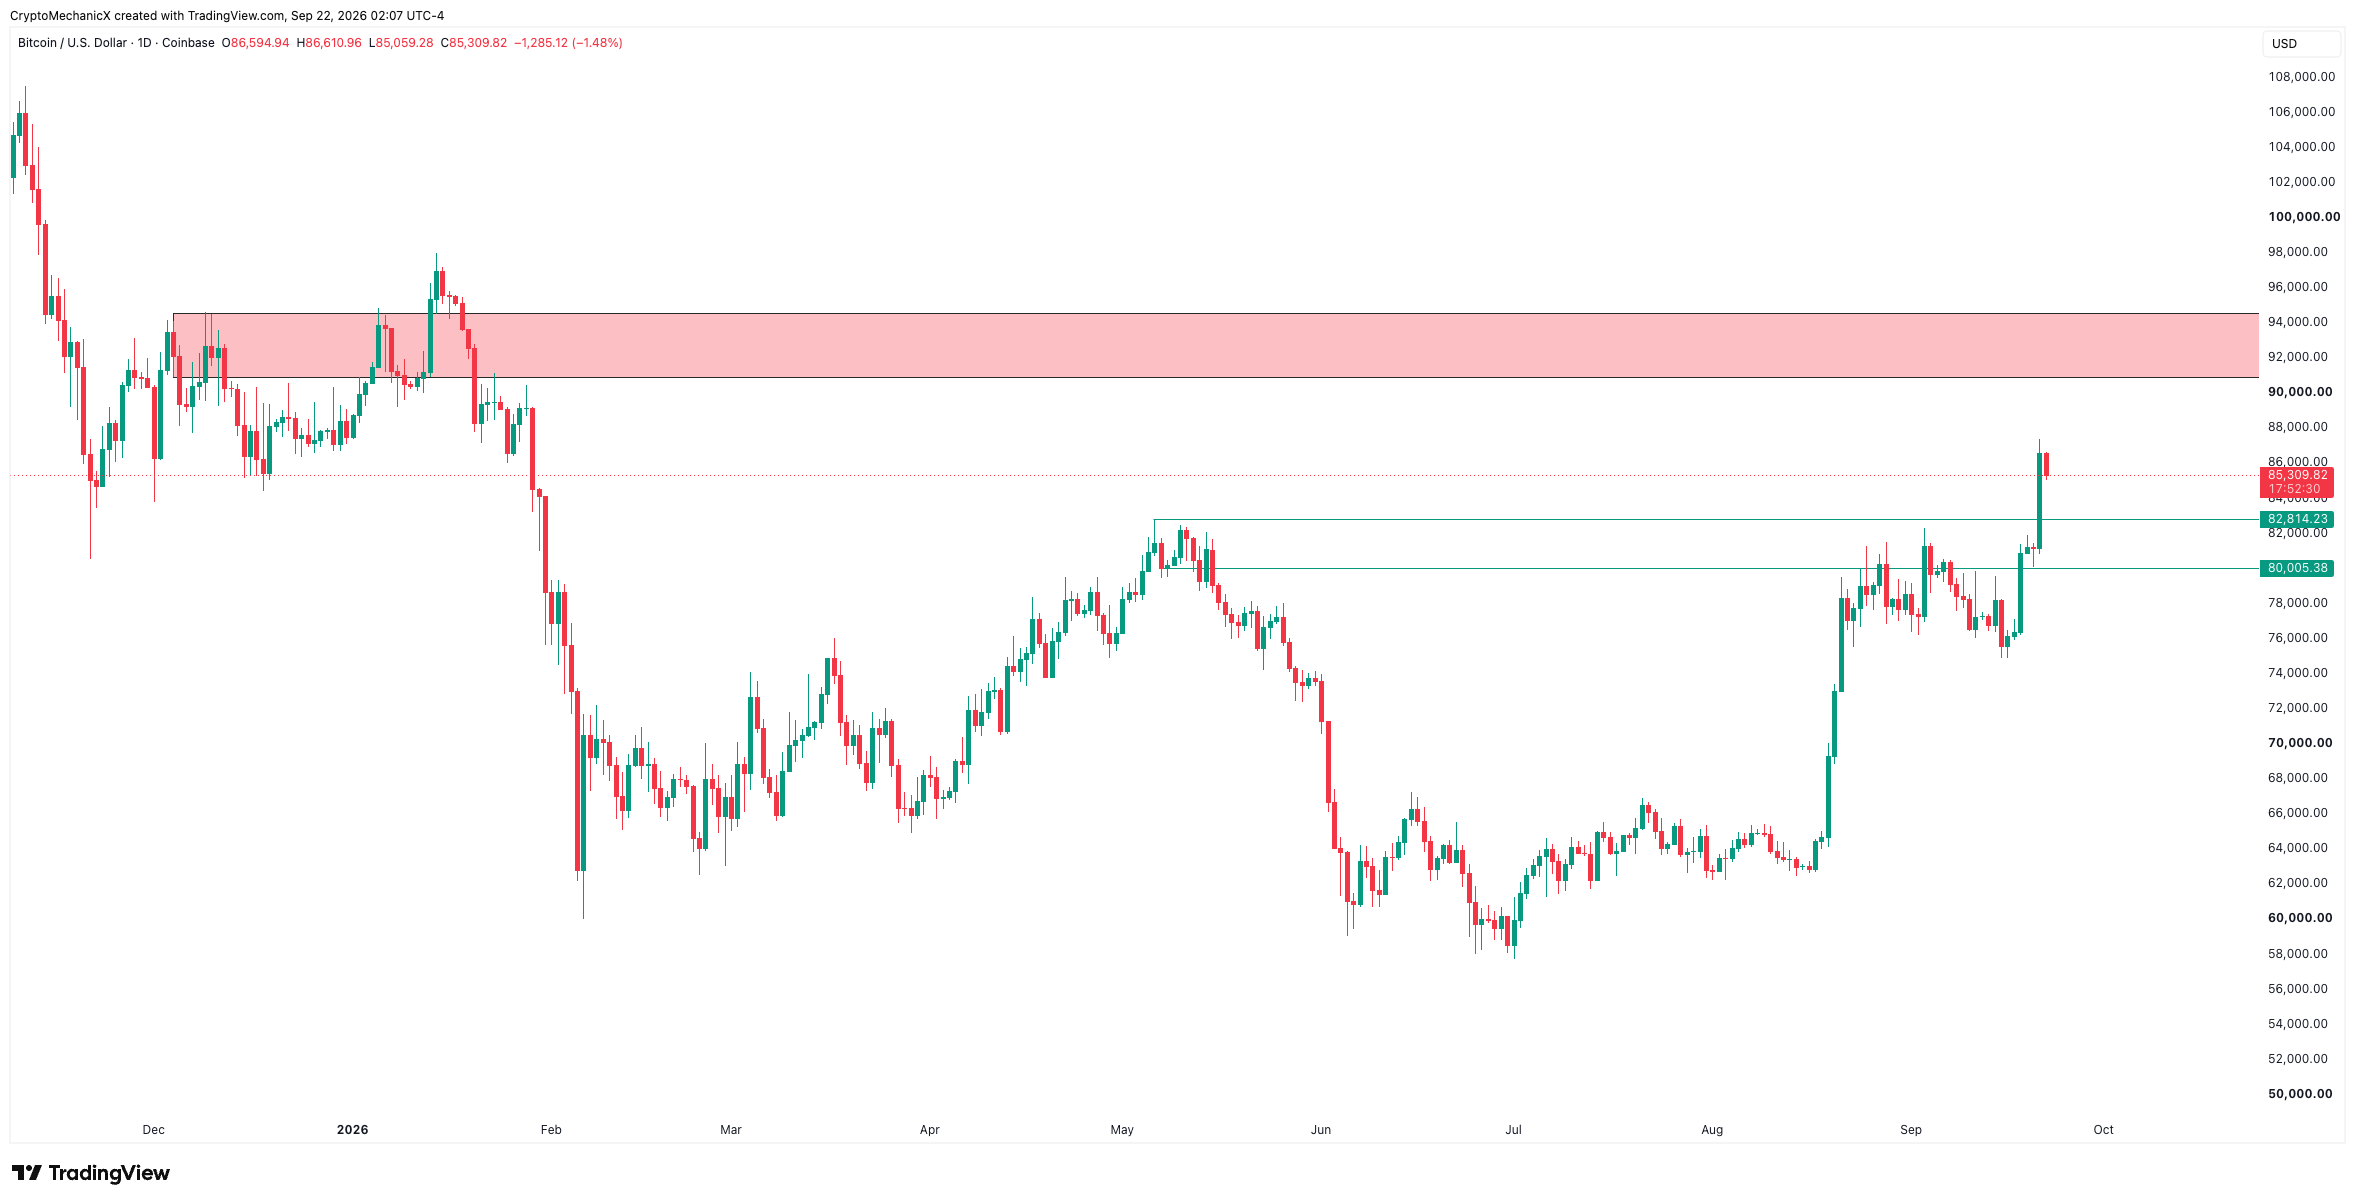
$BTC
Broke through the major resistance yesterday with a big green candle + high volume.
People really freak out on every red candle and start calling it a fake breakout already.
I think the chart looks pretty clean here. Small pullbacks after a big impulse move are completely fine as long as price doesn't fade the whole move.
As long as price holds above the breakout area, this looks fine to me.
$BTC
Broke through the major resistance yesterday with a big green candle + high volume.
People really freak out on every red candle and start calling it a fake breakout already.
I think the chart looks pretty clean here. Small pullbacks after a big impulse move are completely fine as long as price doesn't fade the whole move.
As long as price holds above the breakout area, this looks fine to me.
Broke through the major resistance yesterday with a big green candle + high volume.
People really freak out on every red candle and start calling it a fake breakout already.
I think the chart looks pretty clean here. Small pullbacks after a big impulse move are completely fine as long as price doesn't fade the whole move.
As long as price holds above the breakout area, this looks fine to me.
29
4
110
84.5k
Really feels good when things go your way.
Really feels good when things go your way.
8
54
5.9k
Log in to explore more content
Join global crypto users on Binance Square
⚡️ Get latest and useful information about crypto.
💬 Trusted by the world’s largest crypto exchange.
👍 Discover real insights from verified creators.
Email / Phone number
Trending Topics
QNTRises39%
47,763 views
1,163 Discussing
🚨 QNT IS SURGING! 📈
$QNT is making a huge move today, climbing nearly 40% as buying pressure accelerates.
The rally has put Quant firmly back in the spotlight, with traders watching to see whether this momentum can continue or if a pullback comes next.
🔥 Key things to watch:
• Strong trading volume
• Momentum above recent highs
• The $100 psychological level
• Whether buyers can maintain control
Big moves bring big volatility. Stay alert and manage risk.
Are you watching $QNT? 👀
#QNT #altcoins #CryptoNews
#qntrises39% $QNT
The07
·4 Likes
·4.1k views
EthereumBreaksAbove$2700
4,247 views
116 Discussing
BitgetBreachForgedRequestsNotStolenKeys
46,838 views
929 Discussing