October 28th BTC Market Analysis and Trading Suggestions:
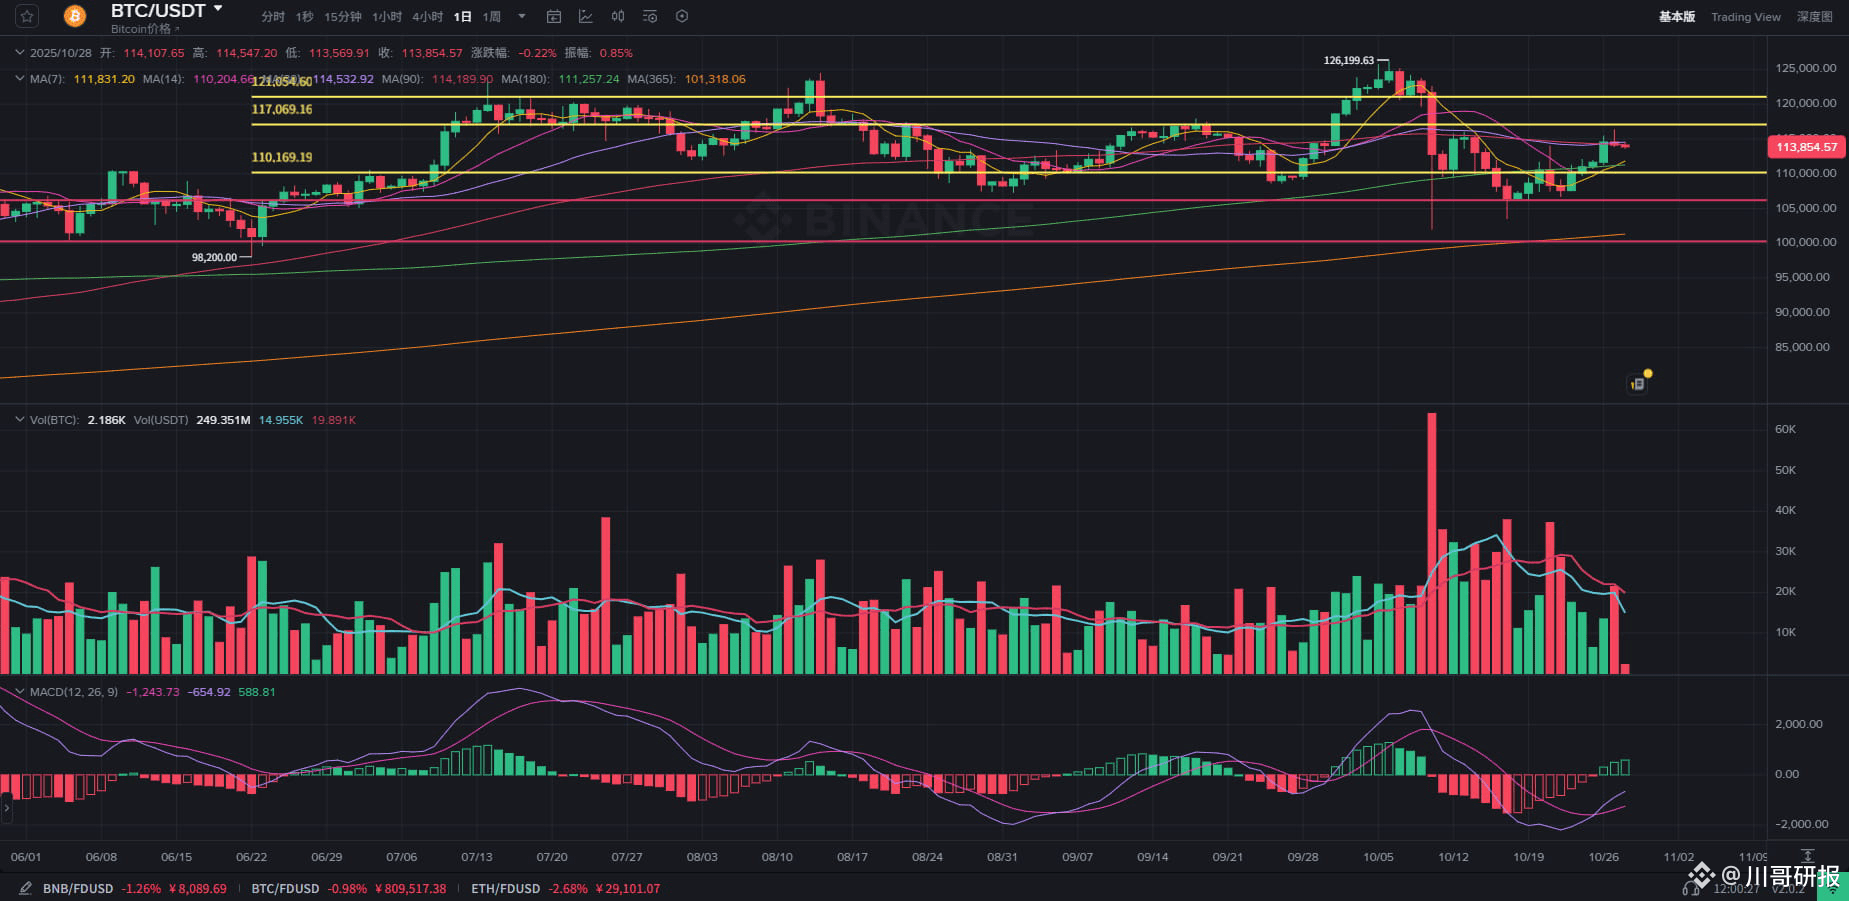
Bitcoin (BTC) showed a high-to-low trend on the daily chart yesterday, ultimately closing with a long upper shadow in a bearish candlestick pattern. This trend clearly indicates that both bulls and bears engaged in a fierce battle at the 116,000 level, with competition being exceptionally apparent. The current daily level has entered the final stage of a medium-term adjustment, and the overall market is in a process of consolidating and building a bottom. After effectively confirming the support below, the price is gradually beginning to recover; however, the resistance from above should not be ignored, and the overall market pattern leans towards a neutral to bullish stance.
Short-term moving averages (MA7 and MA14) continue to extend upward, with the K-line price consistently relying on the short-term averages for upward movement, indicating that a short-term recovery trend has already formed. However, the current price is being pressured by the MA30 average (approximately 114,500), and once this key resistance level is broken, the market is likely to open up new upward space.
In terms of trading volume, after the previous increase in bearish volume, the volume has shown a gradual decline, signaling that the panic selling in the market has largely been exhausted. From the recent volume-price coordination, prices are steadily rising under shrinking volume, while in the downtrend, trading volume has moderately increased, reflecting that bottom-fishing funds are gradually entering the market.
The MACD technical indicator completed a golden cross below the zero axis and is showing an upward divergence trend, with the values of the red energy bars continuously expanding, indicating that the rebound momentum in the short-term market is steadily accumulating.
For the subsequent market trend, within the short-term 1-3 trading days, if the price can break through the 115,000 whole number level with increasing volume, it will officially establish a short-term upward structure, with upward targets looking towards the 121,000-125,000 range. Conversely, if there is no effective breakthrough over three consecutive trading days, it is highly probable that the sideways consolidation in the 111,000-115,000 range will continue.
In terms of intraday trading strategies, it is essential to focus on the support strength in the 113,500-112,500 range below, as this area can serve as a key reference for bullish positioning; above, it is crucial to pay attention to the pressure situation in the 115,000-116,000 range, as this position is the core node for whether the short-term market can further open up space.
Bitcoin (BTC) showed a high-to-low trend on the daily chart yesterday, ultimately closing with a long upper shadow in a bearish candlestick pattern. This trend clearly indicates that both bulls and bears engaged in a fierce battle at the 116,000 level, with competition being exceptionally apparent. The current daily level has entered the final stage of a medium-term adjustment, and the overall market is in a process of consolidating and building a bottom. After effectively confirming the support below, the price is gradually beginning to recover; however, the resistance from above should not be ignored, and the overall market pattern leans towards a neutral to bullish stance.
Short-term moving averages (MA7 and MA14) continue to extend upward, with the K-line price consistently relying on the short-term averages for upward movement, indicating that a short-term recovery trend has already formed. However, the current price is being pressured by the MA30 average (approximately 114,500), and once this key resistance level is broken, the market is likely to open up new upward space.
In terms of trading volume, after the previous increase in bearish volume, the volume has shown a gradual decline, signaling that the panic selling in the market has largely been exhausted. From the recent volume-price coordination, prices are steadily rising under shrinking volume, while in the downtrend, trading volume has moderately increased, reflecting that bottom-fishing funds are gradually entering the market.
The MACD technical indicator completed a golden cross below the zero axis and is showing an upward divergence trend, with the values of the red energy bars continuously expanding, indicating that the rebound momentum in the short-term market is steadily accumulating.
For the subsequent market trend, within the short-term 1-3 trading days, if the price can break through the 115,000 whole number level with increasing volume, it will officially establish a short-term upward structure, with upward targets looking towards the 121,000-125,000 range. Conversely, if there is no effective breakthrough over three consecutive trading days, it is highly probable that the sideways consolidation in the 111,000-115,000 range will continue.
In terms of intraday trading strategies, it is essential to focus on the support strength in the 113,500-112,500 range below, as this area can serve as a key reference for bullish positioning; above, it is crucial to pay attention to the pressure situation in the 115,000-116,000 range, as this position is the core node for whether the short-term market can further open up space.