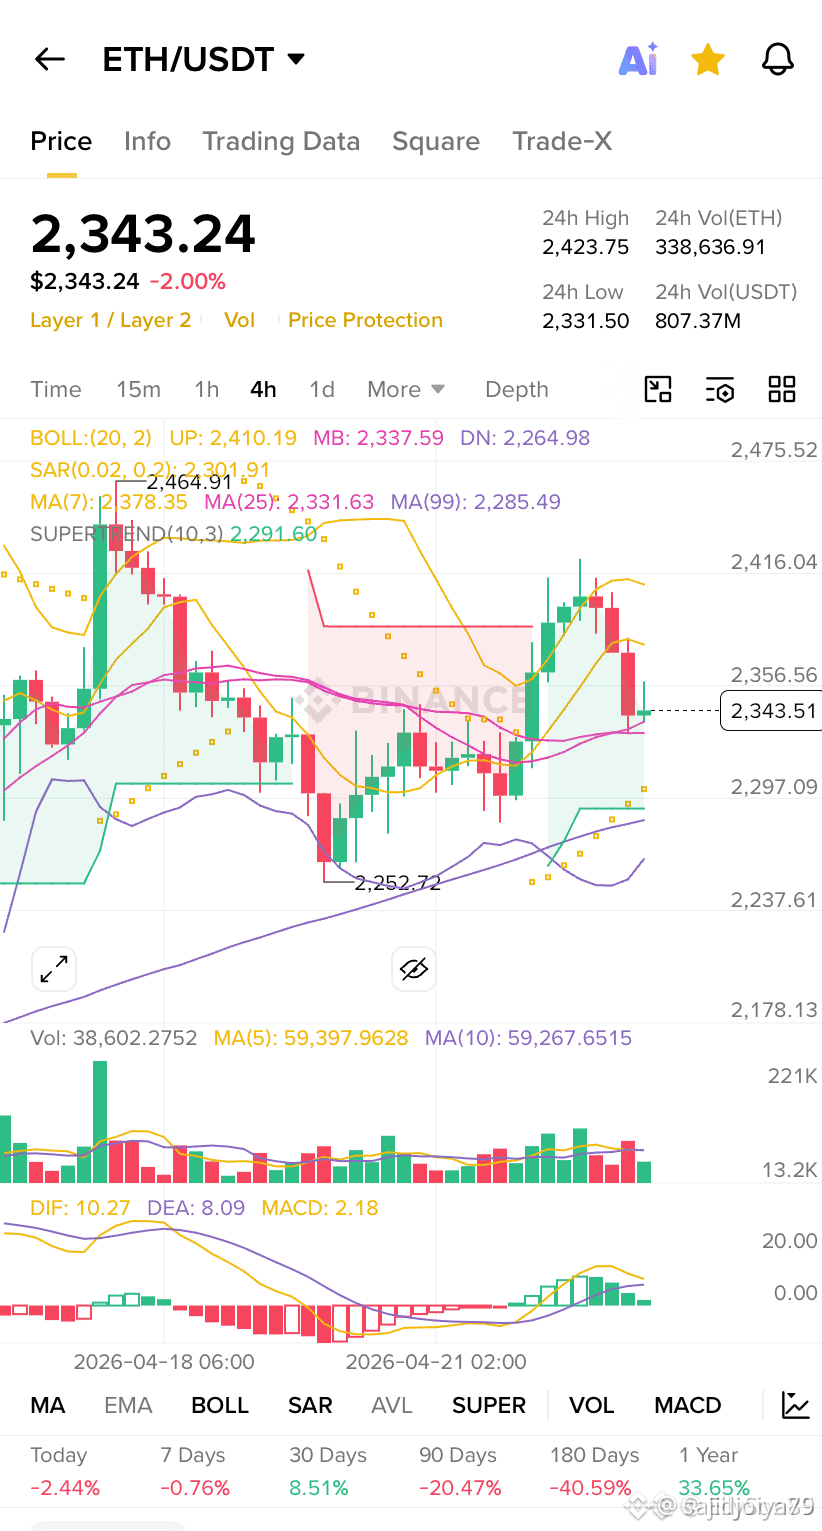
$USDC Alright, let’s break this 4H setup down clearly and logically, what the indicators and signals are showing right now ? Let’s Go!
🔍 Current Structure
• Price is around $2,343, sitting right on the mid Bollinger Band (MB ~2,337) and near MA cluster (7/25).
• We just had a rejection from the upper Bollinger Band (~2,410) followed by a strong bearish candle → short-term weakness.
• The recent move looks like a pullback after a relief rally, not a full trend reversal yet.
📉 Bearish Signals
• Rejection at upper band → classic mean reversion behavior.
• Lower high formed compared to previous swing (~2,464).
• MACD is flattening and starting to roll over → momentum slowing.
• Price lost short-term support around 2,360–2,370.
👉 This suggests sellers are stepping in.
📈 Bullish Context (Still Alive)
• Higher low at ~2,252 is intact.
• Price still holding above MA(99) ~2,285 → key dynamic support.
• Structure still resembles a range / accumulation zone, not a breakdown.
🧠 Key Levels to Watch
• Support:
• 2,330 (current hold zone)
• 2,285 (MA99 + strong support)
• 2,250 (range low)
• Resistance:
• 2,370–2,400 (rejection zone)
• 2,410 (upper band)
• 2,460 (major swing high)
🔮 Probable Next Moves
🟡 Scenario 1: Short-Term Pullback (Most Likely)
• Price consolidates or dips toward 2,300–2,285
• Then attempts another push up
✔ This would form a higher low continuation
🔴 Scenario 2: Deeper Correction
• If 2,285 breaks cleanly, expect:
→ Move to 2,250
→ Possibly range bottom retest
🟢 Scenario 3: Immediate Bull Continuation (Less Likely)
• Strong reclaim of 2,370
• Then push toward 2,410+
⚠️ Needs volume confirmation
🧩 Conclusion
Right now, ETH is in a cool-off phase after a bounce, not a full bearish reversal.
The market is likely ranging between 2,250 – 2,400 before the next decisive move.$USDC $BTC
🔍 Current Structure
• Price is around $2,343, sitting right on the mid Bollinger Band (MB ~2,337) and near MA cluster (7/25).
• We just had a rejection from the upper Bollinger Band (~2,410) followed by a strong bearish candle → short-term weakness.
• The recent move looks like a pullback after a relief rally, not a full trend reversal yet.
📉 Bearish Signals
• Rejection at upper band → classic mean reversion behavior.
• Lower high formed compared to previous swing (~2,464).
• MACD is flattening and starting to roll over → momentum slowing.
• Price lost short-term support around 2,360–2,370.
👉 This suggests sellers are stepping in.
📈 Bullish Context (Still Alive)
• Higher low at ~2,252 is intact.
• Price still holding above MA(99) ~2,285 → key dynamic support.
• Structure still resembles a range / accumulation zone, not a breakdown.
🧠 Key Levels to Watch
• Support:
• 2,330 (current hold zone)
• 2,285 (MA99 + strong support)
• 2,250 (range low)
• Resistance:
• 2,370–2,400 (rejection zone)
• 2,410 (upper band)
• 2,460 (major swing high)
🔮 Probable Next Moves
🟡 Scenario 1: Short-Term Pullback (Most Likely)
• Price consolidates or dips toward 2,300–2,285
• Then attempts another push up
✔ This would form a higher low continuation
🔴 Scenario 2: Deeper Correction
• If 2,285 breaks cleanly, expect:
→ Move to 2,250
→ Possibly range bottom retest
🟢 Scenario 3: Immediate Bull Continuation (Less Likely)
• Strong reclaim of 2,370
• Then push toward 2,410+
⚠️ Needs volume confirmation
🧩 Conclusion
Right now, ETH is in a cool-off phase after a bounce, not a full bearish reversal.
The market is likely ranging between 2,250 – 2,400 before the next decisive move.$USDC $BTC