

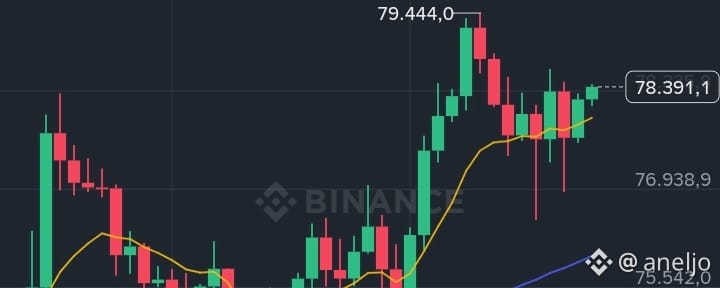

Bitcoin's price is currently in a consolidation phase after a recent bullish impulse that pushed the price up to the 79,400 zone. Since then, the market has entered a short sideways range, showing some indecision.
-Moving averages (EMA)
The 10 EMA (77,955) is hanging above the price at times, acting as immediate dynamic support.
The 55 EMA (75,991) continues with a positive slope, confirming that the underlying structure remains bullish.
-Price structure
A sequence of ascending highs and lows, although with less momentum.
The price is respecting a support zone around the 77,000 – 77,500.
Clear resistance in the 79,400 – 79,700 area, where rejection already occurred.
-MACD Indicator
The MACD shows weakening bullish momentum.
Histogram approaching neutral → possible sideways continuation or a small pullback before deciding direction.
-Volume
Trading volume has decreased during consolidation, supporting the idea of a pause before a stronger move.
Possible scenarios
Bullish: If it breaks strongly above 79,400, it could seek extension toward new highs.
Bearish (pullback): If it loses the 77,000 zone, a pullback toward the 55 EMA as a key support is likely.
-Conclusion
The market is in a pause phase after the impulse. As long as it remains above the 55 EMA, the bias remains bullish, but the weakening momentum suggests patience before the next entry.
-clarification:
This is my personal opinion and not an investment recommendation