


Original author: Tiger Research
Original text translated; AididiaoJP, Foresight News
Key Points
The macro environment remains supportive, although the pace has slowed: global M2 has hit a historic high of $13.44 trillion, and Bitcoin ETF inflows have turned net positive for the first time in 14 months. However, the oil shock from the Iran conflict has pushed March's CPI up to 3.3%, narrowing the Fed's rate cut path.
On-chain metrics for Bitcoin are moving from undervalued to early equilibrium: key on-chain indicators have exited the panic zone of Q1. The current price is $70,500, about 13% lower than the average entry cost of long-term holders at $78,000. Breaking this level would be a major signal for a short-term trend reversal.
The target price of $143,000 and the doubling potential still stand: based on a neutral benchmark of $132,500, adjusted by fundamental -10% and macro +20%. This is a downward revision from the Q1 target of $185,500, but the significant pullback in spot prices means that the actual upside from current levels has increased.
Macro tailwinds are still present, but momentum has slowed
Since the release of the Q1 report, Bitcoin has dropped about 27%, with the average price hovering around $70,500 in early April. The Iran conflict introduced a new variable, but the overall macro environment remains favorable. The direction hasn't changed; only the speed has.
Liquidity is at record highs but has not effectively transmitted to Bitcoin
As of February 2026, the global M2 has continuously expanded to nearly $13.44 trillion, a historical high. However, Bitcoin has dropped 27% since Q1. Liquidity and prices are showing inverse movements.
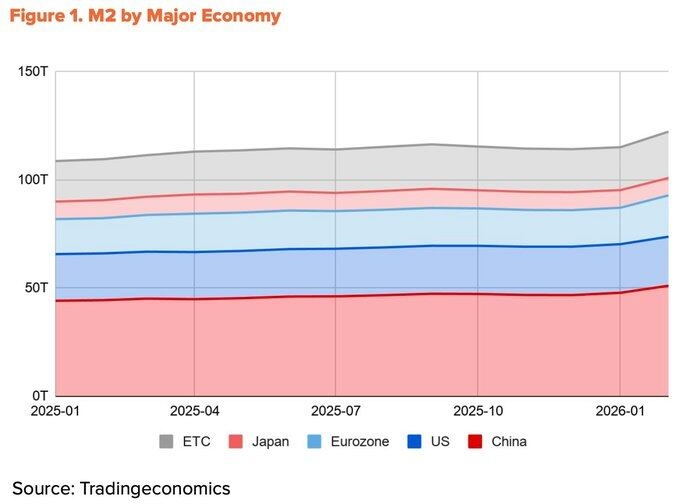
The source of liquidity explains this divergence. In the past year, more than 60% of the M2 growth from the four major economies (China, the US, the Eurozone, and Japan) came from China, thanks to the People's Bank of China's reserve requirement cuts and the formal shift to an easing stance in Q1.
The US contribution is only 10%. The issue is that the channels for Chinese-sourced liquidity to enter the Bitcoin market are limited. Domestic crypto trading restrictions remain in place, and indirect channels through Hong Kong and Singapore mainly serve institutional funds. Global liquidity is at historical peaks, but the share that can actually reach the Bitcoin market is shrinking.
The Iran conflict has slowed the Fed's pace of rate cuts
Due to the blockage of liquidity transmission from China, USD liquidity remains a major driver for Bitcoin. However, even this aspect has been delayed due to the Iran conflict.
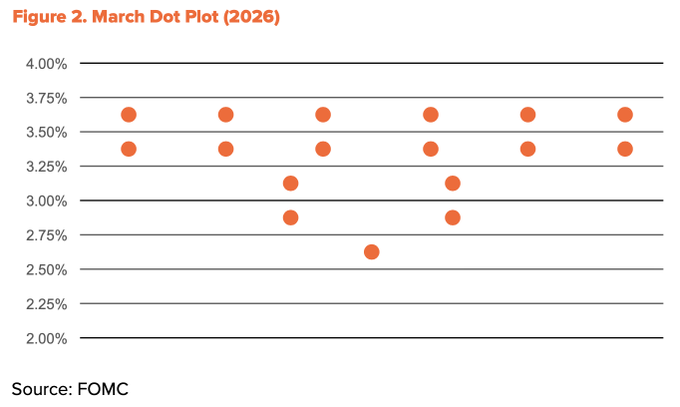
After the US and Israel struck Iran on February 28, the Strait of Hormuz was blocked. Brent crude skyrocketed to $118/barrel in mid-March, while Dubai crude hit a historic high of $166/barrel. This shock directly pushed inflation higher. The US March CPI rose from 2.4% in February to 3.3%, marking a two-year high. The Fed's room for rate cuts has subsequently narrowed, with the March dot plot reducing the expectation for rate cuts in 2026 to just one.
Nevertheless, the direction of easing has not changed. By mid-April, parts of the Strait of Hormuz reopened, and oil prices fell sharply back to around $90. Core CPI stabilized at 2.6%, indicating that the shock has not fully spread to the overall economy. President Trump formally nominated Kevin Warsh to be the next Fed Chair at the end of January, with Senate confirmation hearings underway. Powell's term will end on May 15, and the easing tendency is likely to continue. The number of rate cuts may decrease, but the direction remains unchanged.
Institutional fund flows are starting to reverse
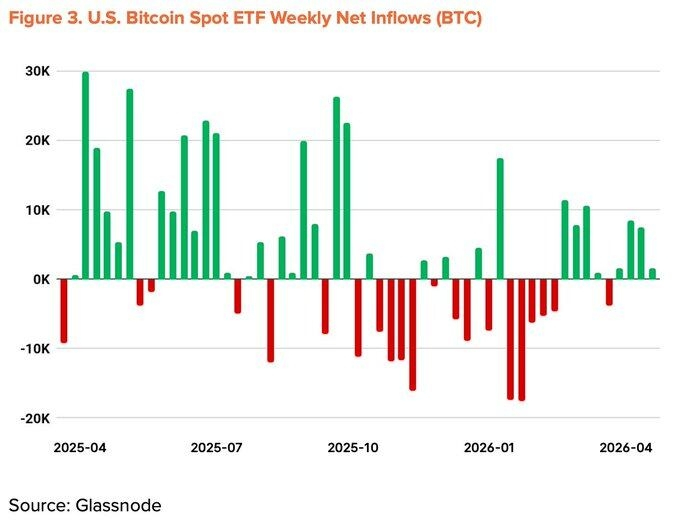
The institutional outflows that drove the decline in Q1 have begun to reverse. Bitcoin spot ETF has recorded its worst monthly outflow since its launch in November 2025, remaining in a net outflow state for five consecutive months. However, since March, monthly net inflows have turned positive. As of mid-April, the cumulative fund flow for the year has turned positive, with total assets under management recovering to $96.5 billion.
Corporate hoarding of coins is also accelerating. Strategy spent $2.54 billion to buy 34,164 Bitcoins in a single week (April 13-19), increasing total holdings to 815,061 BTC. However, the number of companies participating in this trend has not significantly increased.
Macro indicators adjusted down to +20%
Structural tailwinds remain intact: liquidity expansion, a tendency towards policy easing, institutional funds returning to positive flow, and progress on the US CLARITY Act. Recent headwinds—oil shocks triggered by Iran and the Fed's rate cut slowdown—partially offset these positives. Macro indicators for Q2 have been adjusted down by 5 percentage points from Q1 to +20%.
Transitioning from undervaluation to early equilibrium
On-chain indicators have exited the extreme fear zone and are transitioning towards undervaluation and equilibrium boundaries. Key metrics like MVRV-Z, NUPL, and aSOPR have moved out of the panic zones seen in Q1 and entered an early recovery phase. While a huge bounce like that from the panic zone is unlikely, historical data shows that the average return from this area tends to remain double-digit. The risk-reward ratio at this point is still in the most favorable position.
It's worth noting that the average cost basis for short-term holders (STH) is gradually decreasing. This indicates that speculative funds are exiting, while new buyers are accumulating at lower price levels. The timing aligns with the restart of ETF net inflows and large-scale purchases by Strategy, supporting the view that institutional investors are continuously accumulating in the discounted range, thereby lowering the average entry cost.
The key risk level is $54,000, which is the average cost basis across the network. If it drops below this level, the entire network would enter an unrealized loss state, becoming a bottom in extreme scenarios. The strongest resistance is at $78,000, which coincides with the average entry cost of long-term holders.
The current price of $70,500 is about 13% lower than that resistance level, with a lot of short-term capital that entered recently sitting on unrealized losses. A decisive break above $78,000 is worth close attention in the short term.
Surface growth, underlying stagnation
In the first half of April, Bitcoin's average daily trading volume reached 564,000 transactions, a year-on-year increase of 37.9%. The surface data looks impressive, but the details tell a different story.
During the same period, the number of active addresses dropped to 428,000, a year-on-year decrease of 13.2% and a quarter-on-quarter decrease of 4.2%. The average transfer size fell to 1.19 BTC, down 34.1% from 1.80 BTC in the previous quarter. The number of transactions has increased, but both the number of participants and the value per transaction are declining. This pattern reflects that a few users are repeatedly making small transfers rather than widespread economic utilization of the network. A significant portion of the increase in transaction volume may stem from mechanical flows like exchange deposits, unrelated to real growth.
The Q1 report maintained fundamental indicators at 0%, based on expectations of BTCFi ecosystem expansion. Entering Q2, this argument has clearly weakened. According to The Block (2026 Digital Asset Outlook), Bitcoin L2 TVL has dropped 74% this year, with total BTCFi TVL declining by 10%, now accounting for only 0.46% of Bitcoin's total supply (91,332 BTC). While some protocols like Babylon and Lombard have seen growth, the entire ecosystem has contracted.
Fundamental indicators adjusted down to -10%
Surface growth has not translated into real network expansion, and the underlying data supporting the BTCFi argument has weakened. The balance of positive and negative signals that offset each other in Q1 has been broken. In Q2, fundamental indicators have been downgraded from 0% to a floor of -10%.
Target price of $143,000 still has double the upside potential
Using the TVM method, the neutral benchmark based on the average price calculated for early April 2026 is $132,500. After adjusting for fundamental -10% and macro +20%, the 12-month target price is set at $143,000.
This figure is about 23% lower than the Q1 target of $185,500. However, the actual upside potential has instead expanded. Calculated at an average price, the upward space has increased from +93% in Q1 to +103% in Q2.
Adjusting the target price does not indicate pessimism. The macro direction and on-chain structure still support the mid- to long-term bull market logic.
Three short-term observation points:
Decisively broke through the mid-term equilibrium level of $78,000 across the network;
ETF continues to see net inflows;
After geopolitical risks eased, the Fed's policy shifted.
If these three conditions are met simultaneously, the target of $143,000 remains achievable.