

By analyzing the specific position data, the narrative of a short squeeze strengthens.
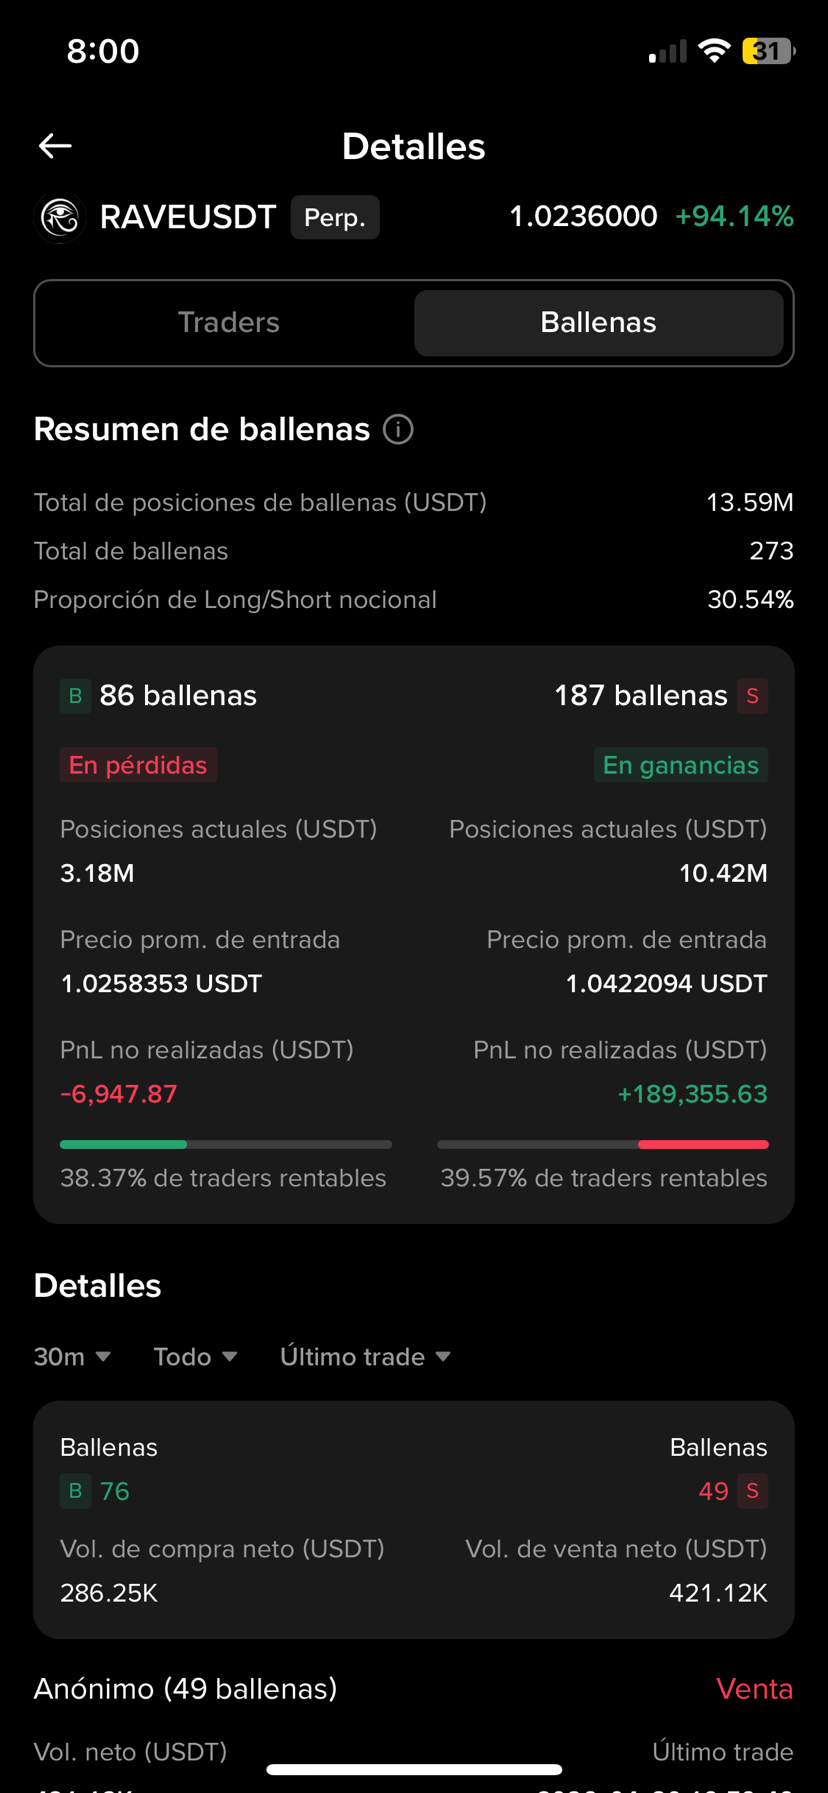
Image 0 (Whales): The summary is clear: Whales are overwhelmingly short.
• Total Whales: 273.
• Capital Distribution: 10.42 million USDT are in short positions (Bear) vs. only 3.18 million in long positions (Bull).
• Ratio: 187 whales are short vs. 86 are long.
This means that "smart money" or big players are heavily betting against the token at this time. However, my thesis is based on observing the speed at which the unrealized PnL (Profit and Loss) of these whales changes. A slight upward movement is already making these large positions that entered near the lows nervous.
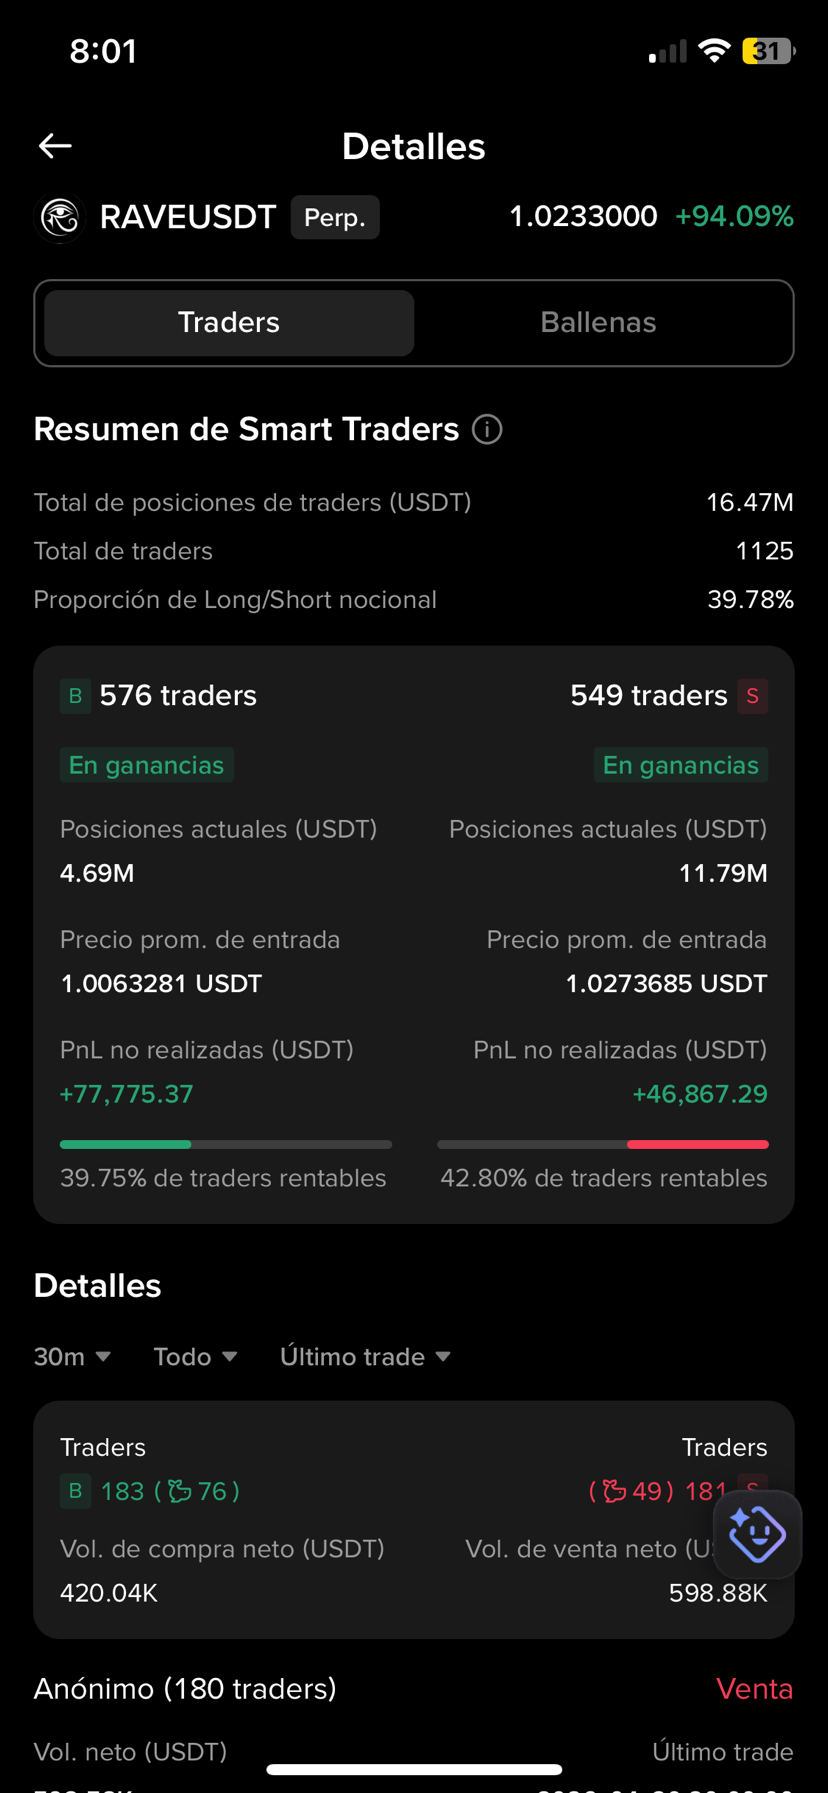
Figure 2 (Smart Traders): These data add an intriguing layer of complexity.
• While by trader count, there are more long traders (576 Bulls vs 549 Bears).
• Due to inverted capital, most of the money is still short (11.79 million USDT short vs 4.69 million USDT long).
We have a market where most of the institutional capital and whales are trapped in short positions near the bottom, while a growing base of retail traders is starting to bet on the recovery. This is the perfect recipe for a "short squeeze". If the price continues its current recovery from 0.5 toward the 1.1-1.5 zone, the whales will begin to cover their shorts to protect their profits or cut losses, accelerating the bullish move and trapping the more leveraged smaller traders who keep selling.