The cryptocurrency market is cyclical, but sometimes it offers us dramatic technical scenarios that capture the attention of experienced traders. Currently, the RAVE token (specifically the RAVE/USDT pair in perpetual contracts) is at a fascinating crossroads after experiencing a "deadly" price drop, plummeting from highs near 28.3 to return to its base upward zone around 0.5 in just 20 hours.
While many retail traders flee in fear accusing the token of manipulation, an in-depth analysis of on-chain and market data suggests that the fundamentals for a massive rebound are ready. Here is my thesis on why I believe the price of RAVE is about to rise significantly.
The Liquidity Magnet: An Irresistible Heat Map
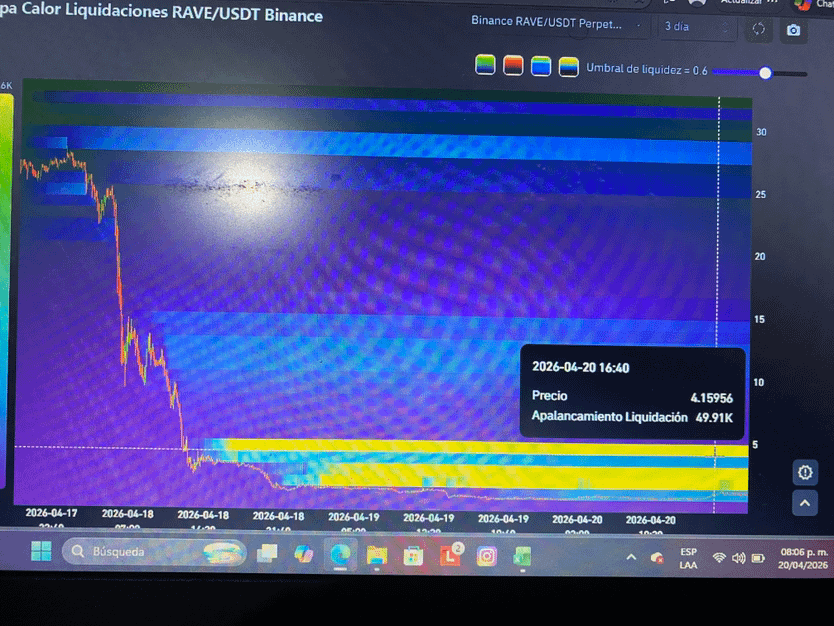
The most powerful visual argument is found in the Heat Map of Liquidations (Image 1). This chart reveals where the "stop orders" (stop-losses) and liquidation prices of leveraged traders are.
The Visualization: We can observe that, after the massive drop to the 0.5 zone (which is now recovering around 1.1-1.5), the chart is incredibly "clean" below. However, above the current price, there are bright and thick yellow bands (massive liquidity).
The Thesis: Traders who aggressively leveraged downward (short) during the drop, believing that the token would fall to zero, have created an unprecedented concentration of liquidity at higher levels (around 15, 25, and even 30). Short liquidations act as forced market buy orders. If the price starts to rise, it will trigger these liquidations like dominoes, violently pushing the price up in a search for this liquidity. The market tends to move towards the highest concentration of available capital.