



Original title: Can Liquidity Win the Battle Against the Next Phase of the Iran War? Why Bitcoin is Becoming a Reliable Liquidity Bellwether.
Original author: Joe Duarte
Original compilation: Peggy, BlockBeats
Editor's note: As the market has just regained upward momentum driven by liquidity, new uncertainties have already accumulated on the other end. The situation in Iran is once again fluctuating, with risks in the Strait of Hormuz becoming apparent, bringing geopolitical conflicts back to the core variables in asset pricing. In just a few days, the market has shifted from a single logic of 'fund-driven' to a dual game of 'liquidity vs risk events.'
The current market is caught between 'liquidity-driven rises' and 'risks from the escalation of the Iran situation.' On one hand, the Federal Reserve and the U.S. Treasury injected nearly $200 billion in liquidity into the financial system in a short time, rapidly pushing the stock market and risk assets to rebound; on the other hand, geopolitical uncertainties, private credit risks, and overheated sentiment make the market still fragile.
In this structure, Bitcoin's role is beginning to change. Unlike traditional risk assets, it is more sensitive to changes in liquidity and often gives signals first when the funding environment turns. Historically, whether it was the early decline in October 2025 or the initial stabilization in this round of rebound, Bitcoin has played a role as a 'leading indicator' to some extent.
Therefore, the question is no longer simply 'Will the market rise?', but rather - as liquidity continues to be released and war risks rise again, which force will dominate pricing? If funding cannot continuously hedge against external shocks, then the current rise may just be a temporary mismatch; however, if liquidity continues, the market may continue to rise amidst fluctuations.
Next, the key is not a single variable, but rather the relative strength between them. And Bitcoin may once again become the asset that provides the earliest answers.
The original text is as follows:
'Oh, think twice, for today is just another day in 'paradise' for you and me.' - Phil Collins
For traders and investors, Friday was an unusual trading day. But there is still some time before Monday, and the market is already brewing new variables - news reports as early as Saturday morning indicated that Iran's stance on the Strait of Hormuz issue has reversed, which could once again trigger market turmoil.
Moreover, Friday's rebound has pushed the market sentiment indicators (see below) to a relatively weak position, making the market more susceptible to a pullback. This places the market in a 'tug-of-war': one side is the large liquidity injection mentioned below, while the other side is the uncertainty brought about by the possible reversal of the Iran war situation.
What just happened?
The impact of liquidity on the market is facing a test - the opponent is the possible exacerbation of volatility from the Iran war.
Question: What happens if about $200 billion flows into the financial system almost simultaneously?
Answer: Asset prices will experience a sharp 'short squeeze' (melt-up).
Recently, I have been focused on four common factors suppressing the stock market: the Iran war, the liquidity tightening in the financial system that has persisted since January of this year, widespread pessimism in the market, and a lack of understanding of the true state of the private credit market.
But last week, these factors were almost 'all overturned': the liquidity tightening reversed, the situation in Iran seemed to ease, and the pessimistic sentiment in the market was once again proven - it is often a leading indicator of potential rebounds in the stock market.
Have we escaped from danger? No one can be sure because the situation in Iran is heating up again. Moreover, if investors re-enter 'panic mode', liquidity may dry up again. We still lack a clear understanding of what is happening in the private credit market.
However, for now, let's focus on a relatively observable variable: liquidity.
Double 'liquidity tsunami'.
If you are wondering where the funds that drove the stock market up in the past two weeks came from - think again: the answer is the Federal Reserve and the U.S. Treasury. Together, around April 15, they injected approximately $200 billion into the financial system, providing traders with a 'tax day buffer.'
First, let's look at the first 'barrel' - the Federal Reserve.
On April 15, the Federal Reserve injected nearly $11 billion into the market through repurchase (Repo) operations (via Treasury bonds and mortgage-backed securities). This is already a significant amount, but more crucially, the Federal Reserve is still injecting about $40 billion into the market each month through its Reserve Management Purchase Program (RMP).
What is truly worth noting is the second 'barrel' - the U.S. Treasury.
With the analysis by Garret Baldwin, the U.S. Treasury injected approximately $140 billion to $200 billion into the market during the same period. In other words, roughly calculated, without any formal quantitative easing (QE) announcements, the Federal Reserve and the Treasury collectively injected nearly $240 billion in liquidity into the market quietly.
It's not hard to understand why the stock market has surged explosively.
The more covert part: the Treasury's operations.
How did the Treasury accomplish this 'covert operation'?
The key lies in one account - the 'General Account of the U.S. Treasury' (TGA) held at the Federal Reserve. When the balance of this account rises, it usually means liquidity tightening; when the balance falls, it means liquidity release.
According to Garret's calculations, the balance of the U.S. government's 'checking account' at the Federal Reserve fell from approximately $837 billion before and after tax day to about $697 billion. It then rose again to approximately $924 billion on April 15.
The key is that about $140 billion of this had already flowed into the banking system before tax day, meaning that before April 15, the financial system was actually in a 'liquidity-rich' state.
Interestingly, the National Financial Conditions Index (NFCI), which is tracked weekly in this report, has reversed the previous tightening trend in the latest data (April 10).
We have already pointed out this change in our (Smart Money Passport) daily report: 'The Federal Reserve injected approximately $10.5 billion into the financial system that day, while the NFCI index fell for the first time since January 23, 2026. These two signals combined may indicate that the Federal Reserve has adjusted its stance on tightening liquidity.'
The next biggest suspense is: can liquidity take the lead, or will a new round of escalation in the Iran war become the core variable of the market again?
Bitcoin is beginning to 'activate': Why it is the barometer of liquidity.
The following trend of Bitcoin is crucial.
Because compared to stocks, Bitcoin is more sensitive to liquidity. Therefore, its recent performance after breaking through $75,000 and whether it can challenge the $80,000–$85,000 range is worth paying close attention to.
From a technical perspective, the resistance in the $80,000–$85,000 range is not strong. The volume distribution (VBP) in this range is relatively thin, indicating that effective support was not established during the previous decline. Therefore, under normal circumstances, when prices recover, this position should not constitute strong resistance.
If the market fails here, it means two things: first, the market lacks confidence in this round of rebound; second, there may be issues with liquidity itself. More importantly, if Bitcoin cannot break through this key range, it may also indicate that the 'liquidity tsunami' created by the Federal Reserve and the Treasury is rapidly receding.
If the $200 billion of bank reserves is digested by the market in just a few weeks, it will be a dangerous signal. This could mean that private credit markets or other external risks are building up.
Don't forget that the decline in Bitcoin in October 2025 accurately predicted the difficulties of the stock market in 2026. Meanwhile, Bitcoin also stabilized ahead of the stock market bottom and rebounded in advance when the Federal Reserve and the Treasury released liquidity.
In the context of the ongoing evolution of the Iran situation and global risks not dissipating, if Bitcoin weakens, it should not be overlooked.
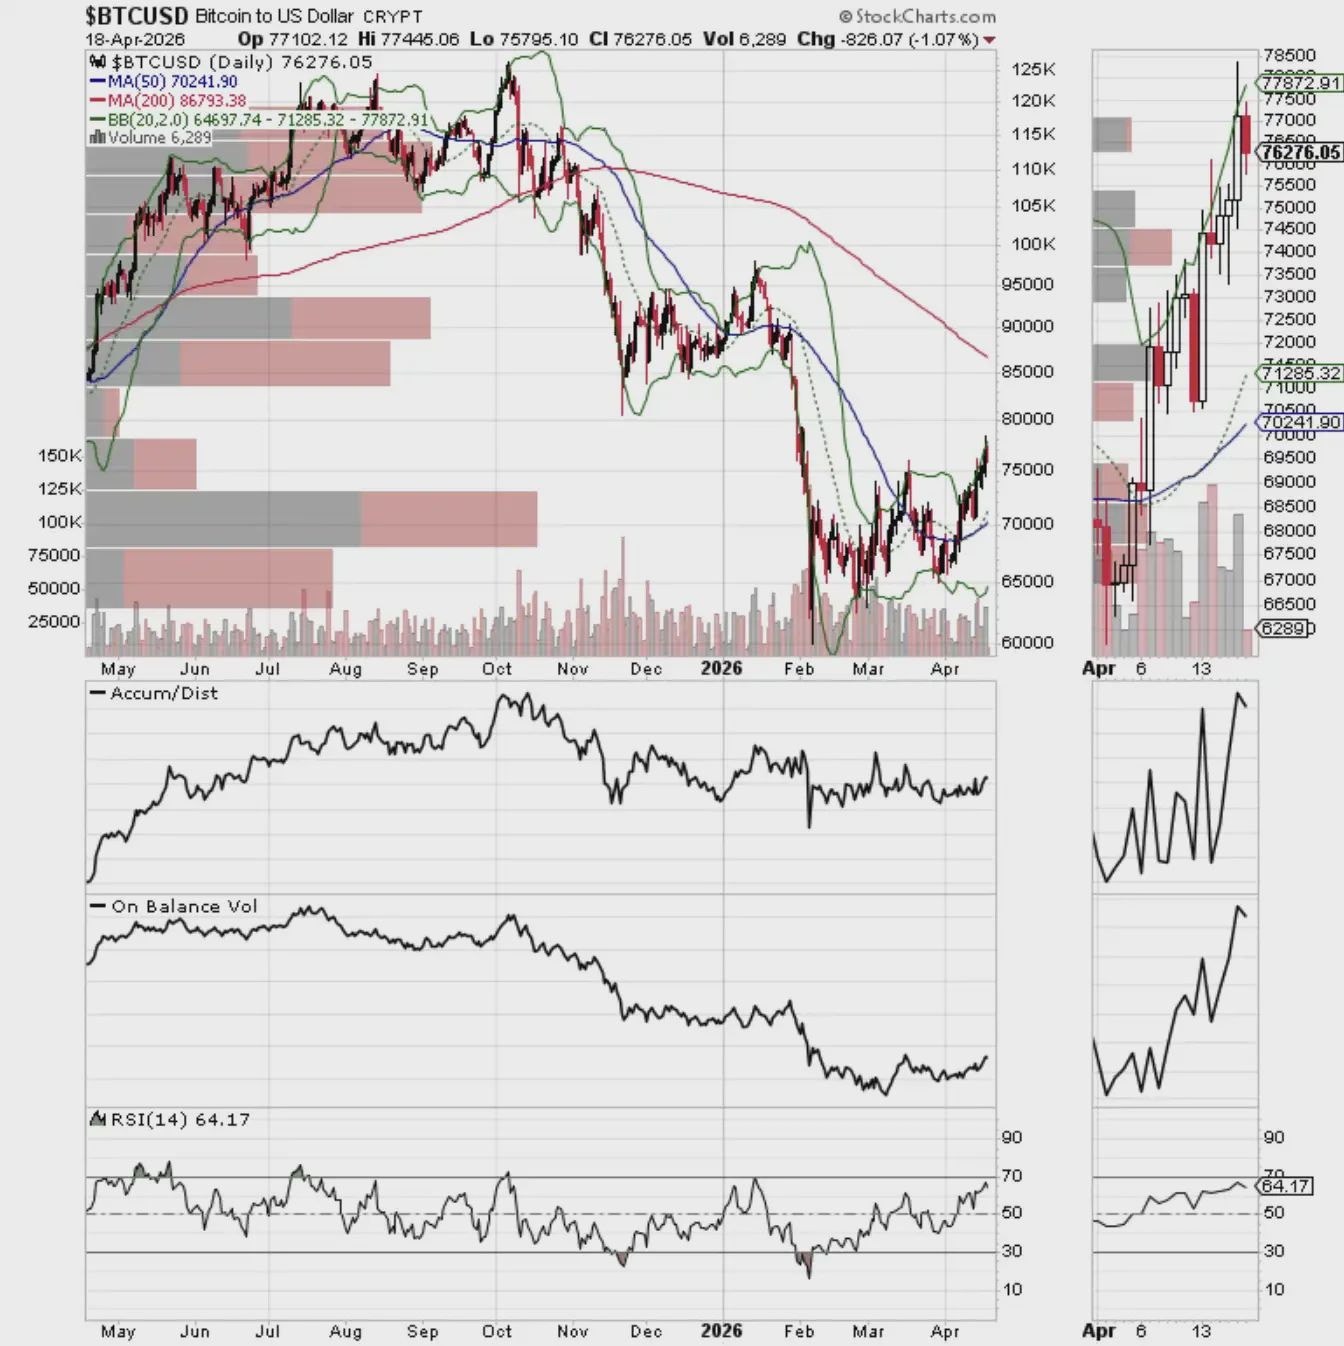
The $70,000–$75,000 range is a key support level.
Sentiment summary: The market has suddenly turned broadly optimistic.
The CNN Fear & Greed Index (GFI) closed at 68 on April 17, 2026, within the 'greed' range.
The Fear and Greed Index of the crypto market from CoinMarketCap was at 59 on Saturday morning, representing a relatively high 'neutral' level.
The Chicago Board Options Exchange (CBOE) overall put/call ratio is 0.65, with the P/C ratio for index options closing at 0.82. Currently, the overall sentiment in the options market remains neutral, but with the rapid warming of bullish sentiment, it is gradually tilting towards the bearish area.
The CBOE Volatility Index (VIX) closed at 17.48, which is a relatively positive level. However, it may still rise above 20 in the short term (usually seen as a risk alert line).
It is important to note that the VIX usually rises when traders buy a large number of put options. Increased demand for put options forces market makers to hedge by selling index futures, thereby creating downward pressure on the market.
Conversely, when the VIX declines, it means that demand for put options decreases, market sentiment shifts to optimism, and subsequently, there is often an increase in call option buying. This encourages market makers to buy index futures to hedge risk, thereby increasing the probability of a stock market rise.
Liquidity observation
1. Good news: Liquidity is loosening.
The latest reading of the National Financial Conditions Index (NFCI) released by the Federal Reserve on March 27, 2026 (published on April 10) was -0.47, a further decline from -0.44 the previous week, indicating that financial conditions are loosening and liquidity is improving.
A decrease in the NFCI is usually seen as a bullish signal, while a negative index means that market liquidity is relatively ample.
2. Bond yields have declined.
U.S. Treasury yields have retreated somewhat later in the week, but with the developments in the Iran situation, they may still rise again in the future.
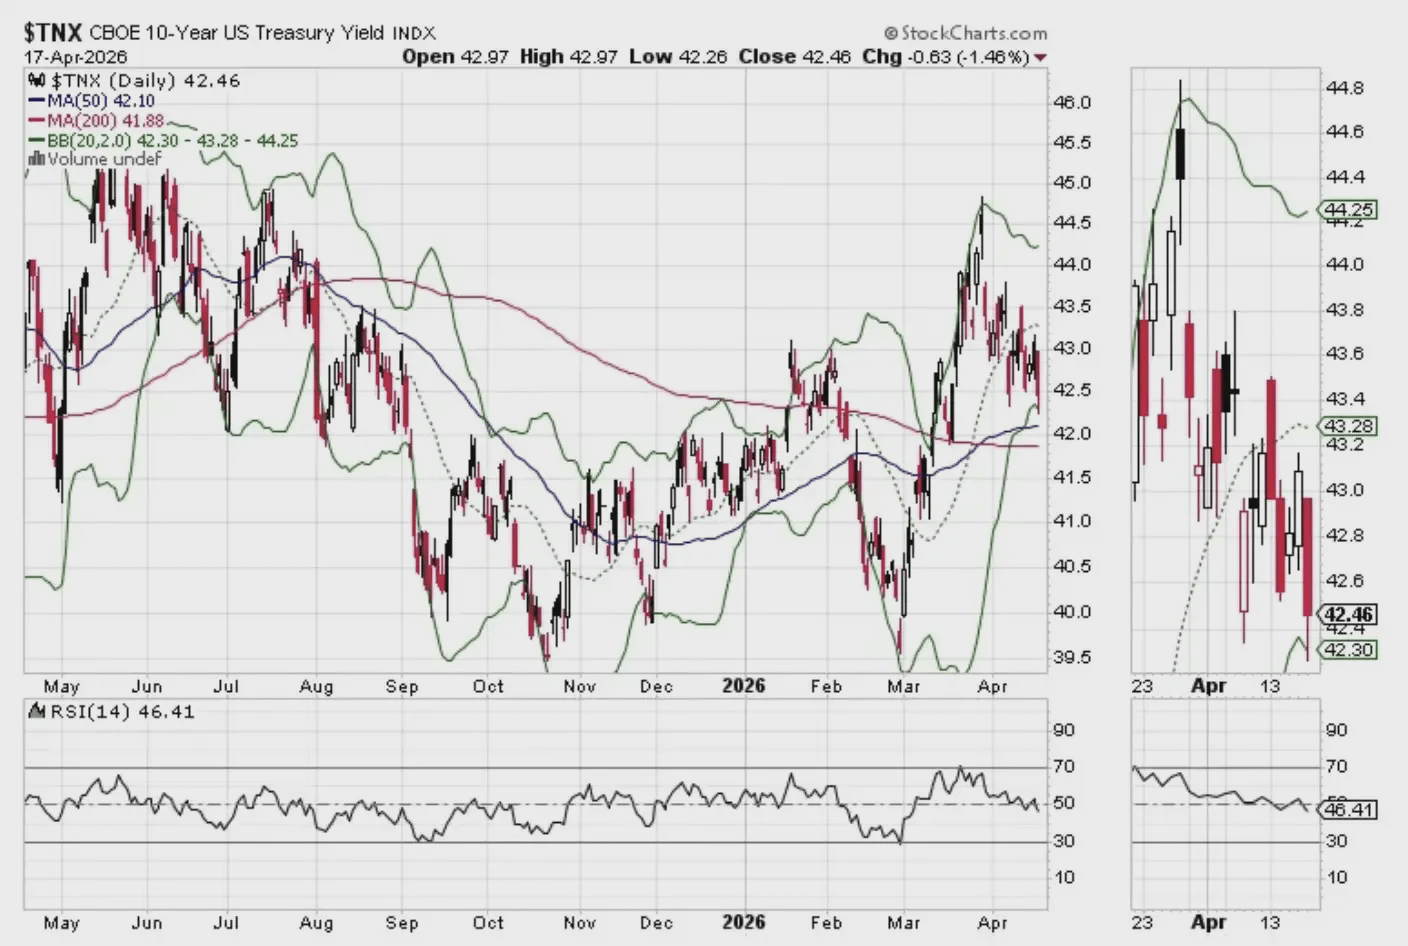
The U.S. 10-Year Treasury Yield closed below 4.3% this week, while also falling below its 20-day moving average. If it further drops below the 200-day average, it will be seen as a bullish signal; conversely, if it rises above 4.5% again, it may push yields back to the near 4.6% high of May 2025.
3. NYAD, SPX and NDX all hit new highs simultaneously.
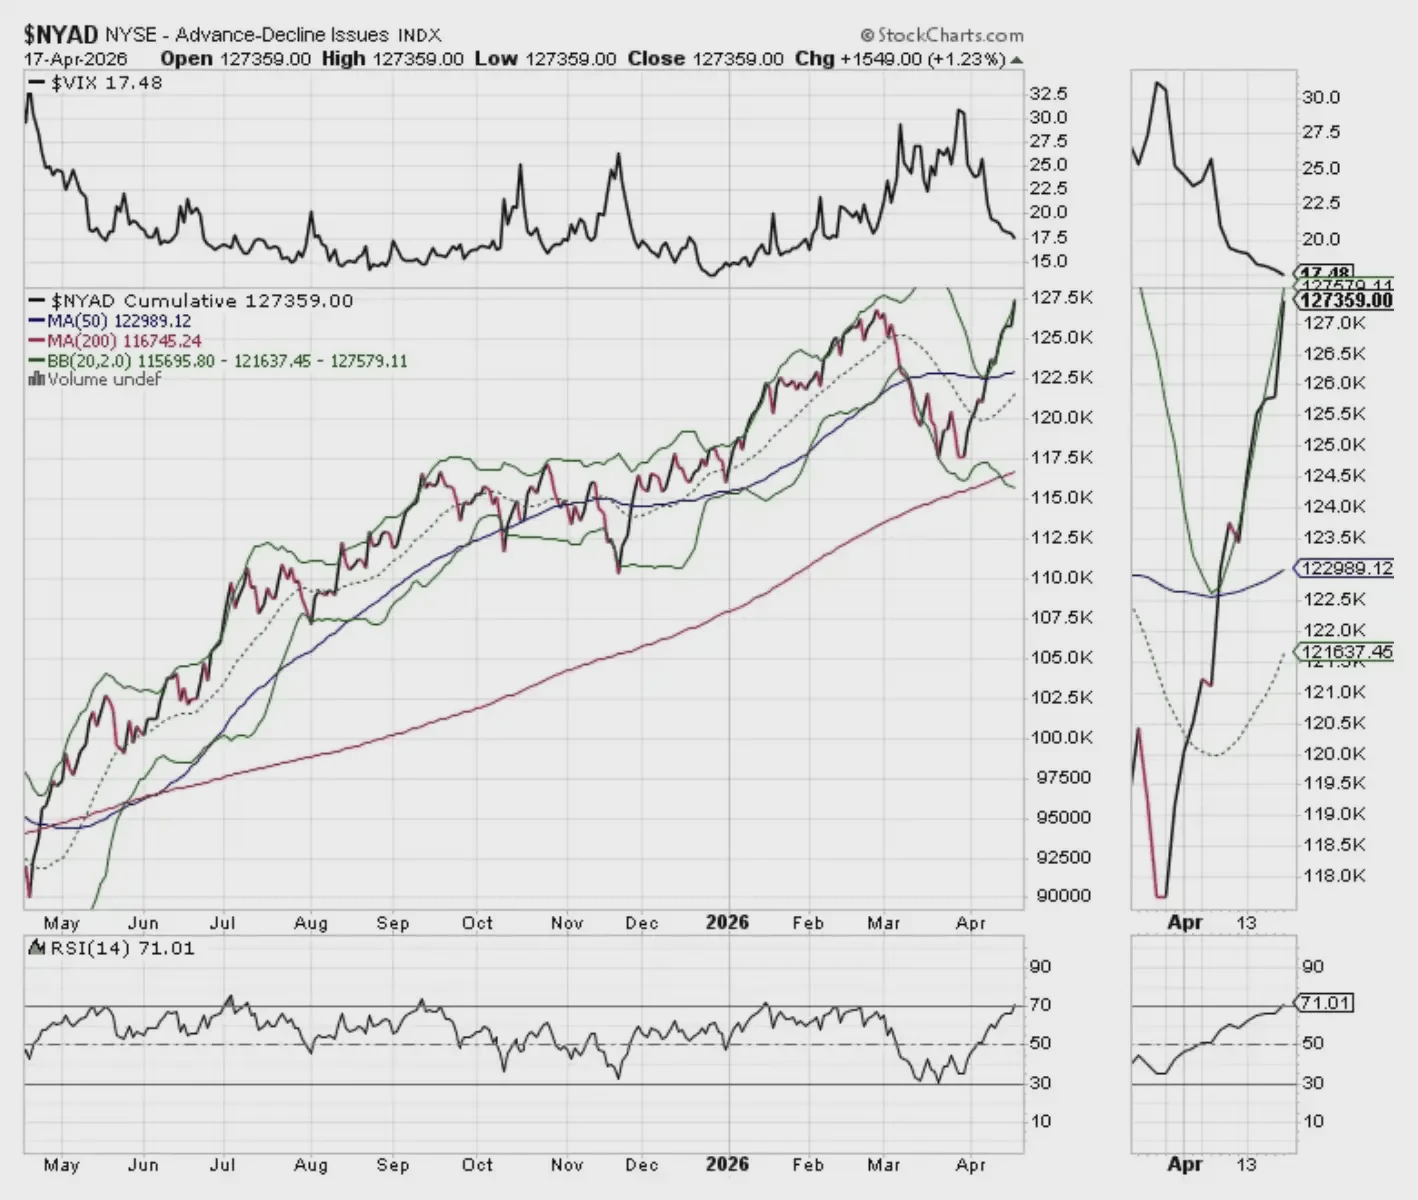
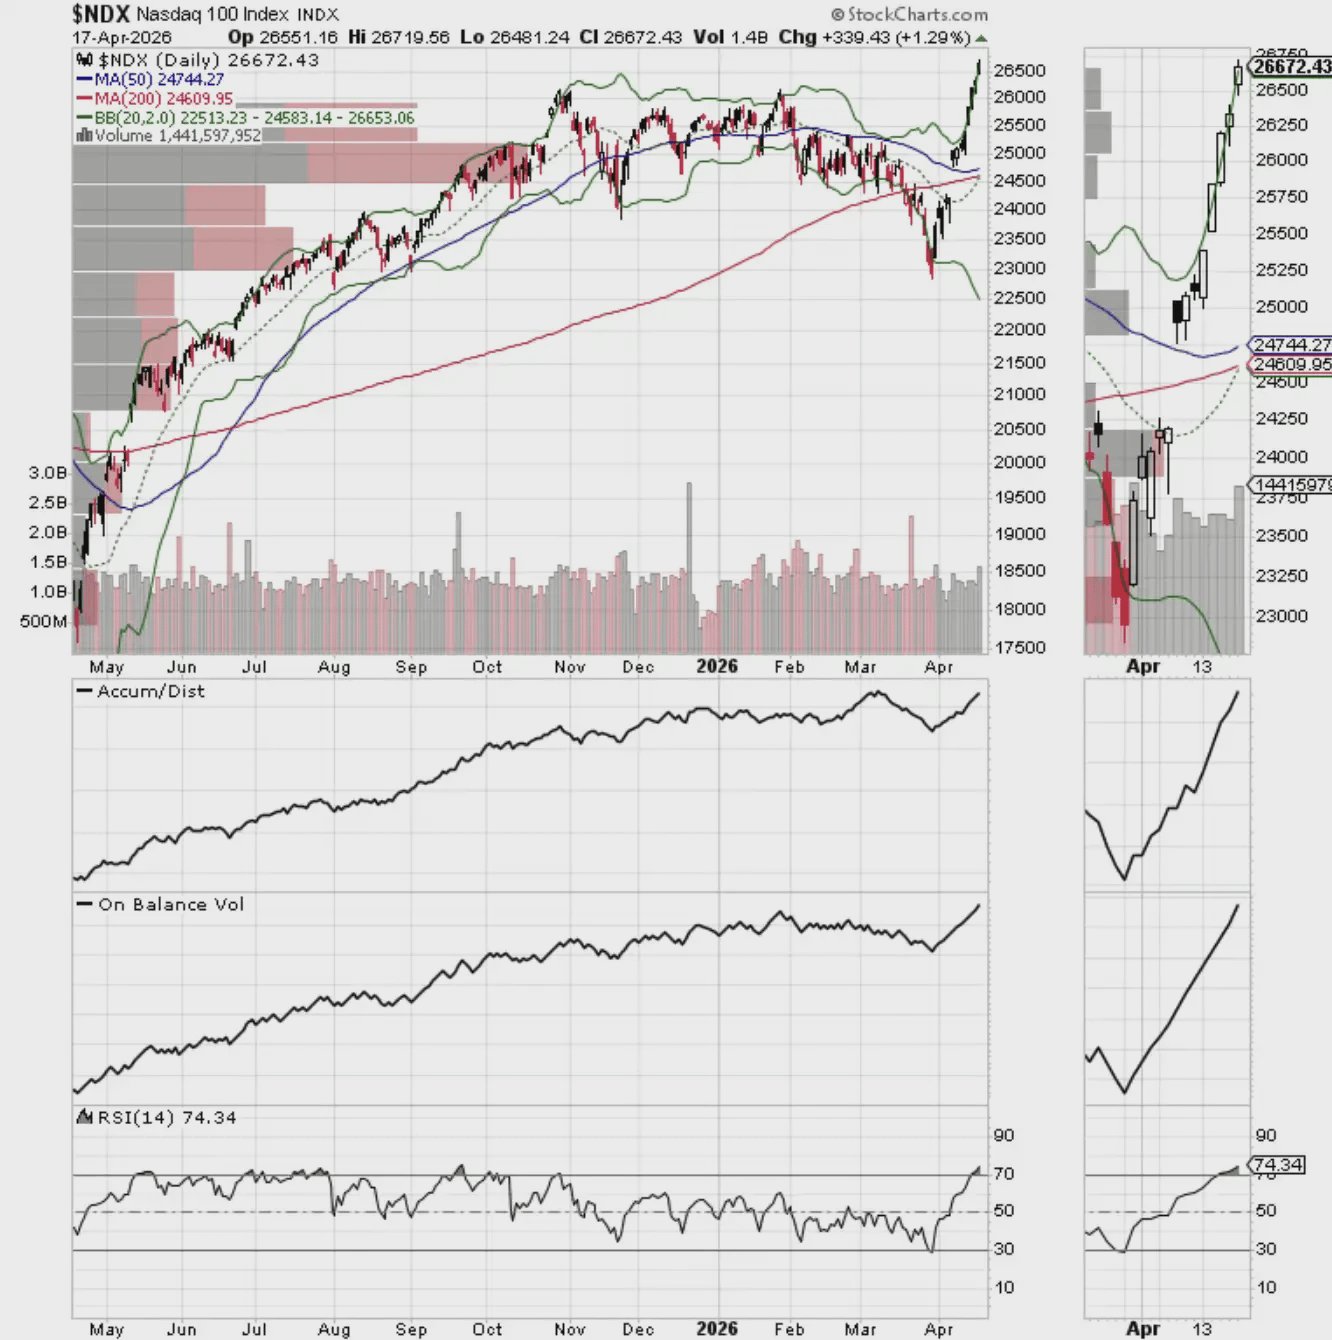
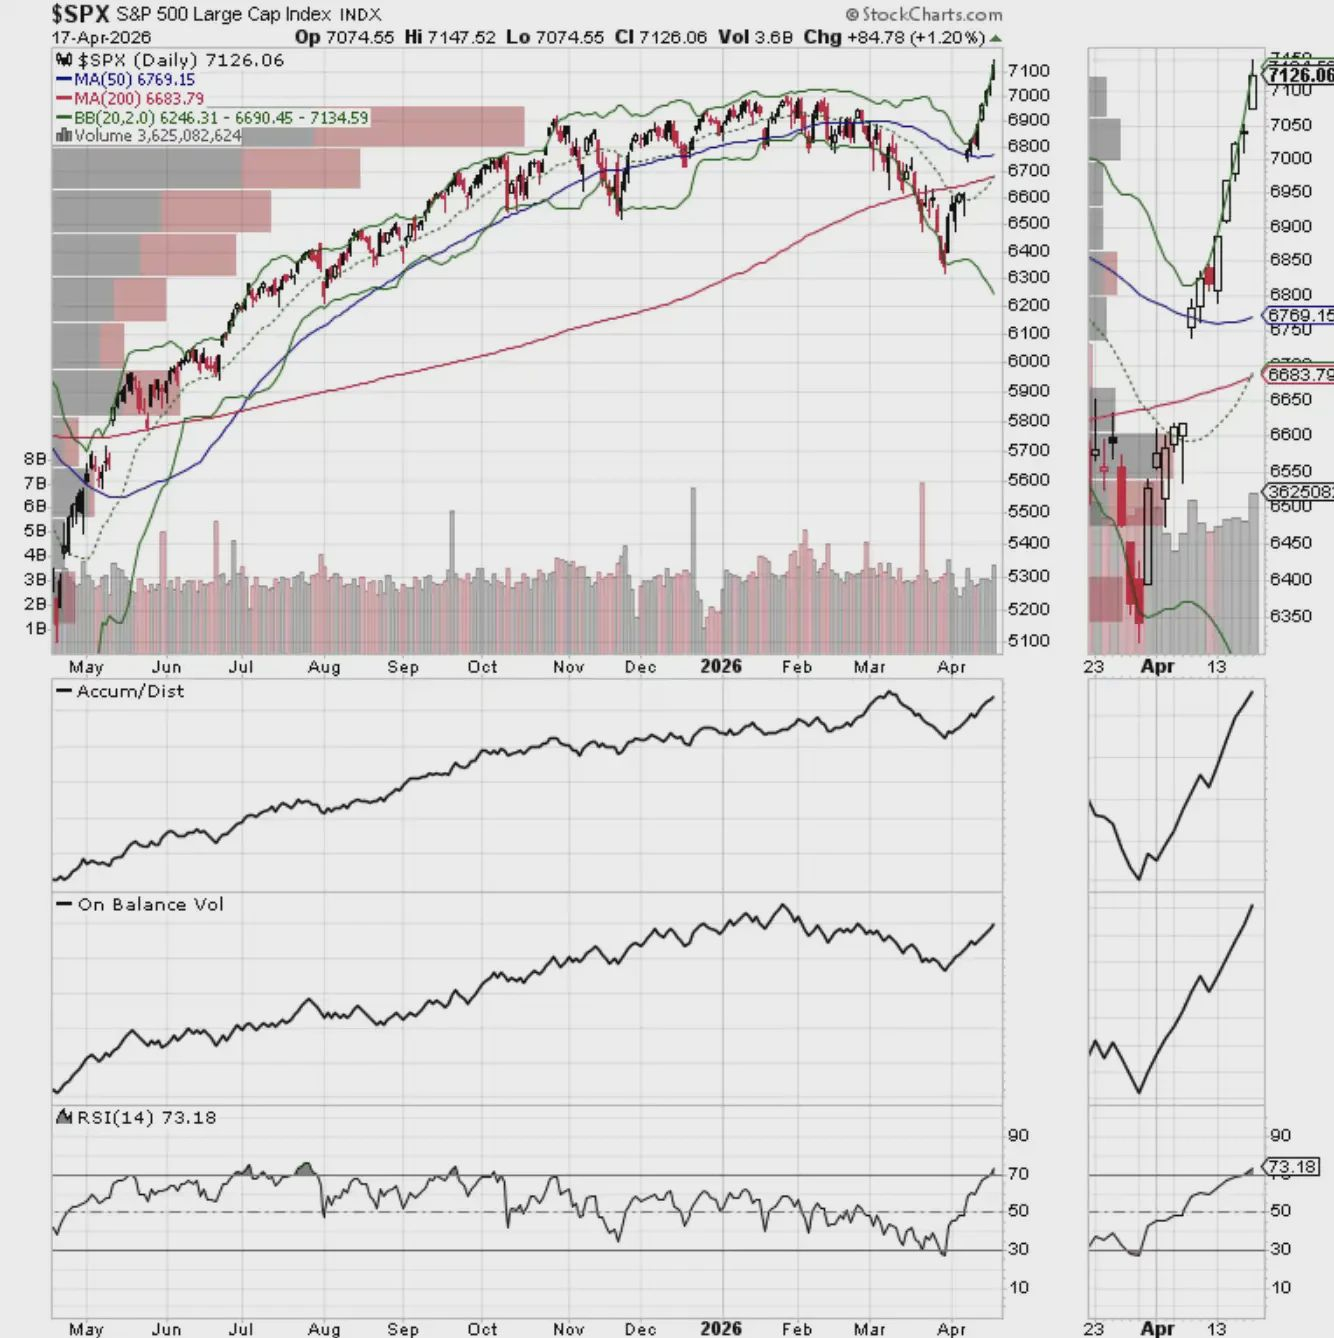
The NYSE Advance-Decline Line reached a new high, synchronizing with the S&P 500 Index and NASDAQ-100 Index to form a confirmation signal.
The current upward trend is validated - but only temporarily. Once it breaks below the 20-day or 50-day moving average, the market situation may change rapidly.
The NASDAQ-100 Index reached a new high last week, and 26,000 points have now become a short-term support level.
The S&P 500 Index reached a new high last week, breaking through the 7000 point mark. 7000 points has now become a short-term support level.
Original link