



The current market setup is approaching a critical turning point, where the bulls need to exert increased pressure.
From a technical perspective, the 2.57% price increase of Bitcoin [BTC] on April 17 pushed the price back above 76,000 USD, with the candle wick reaching 78,000 USD – a price level that BTC has not challenged in over 70 days.
Currently trading about 4% lower than the 80,000 USD mark, on-chain pressure is beginning to form.
As shown in the chart below, BTC has perfectly bounced from the realized price of the long-term holders (LTH) group from 18 months to 2 years, around the $62,000 area.
In fact, the price has now surpassed the cost price of the short-term holders (STH) group from 1 month to 3 months at around $75,620. However, this is still a critical area where supply tends to increase.
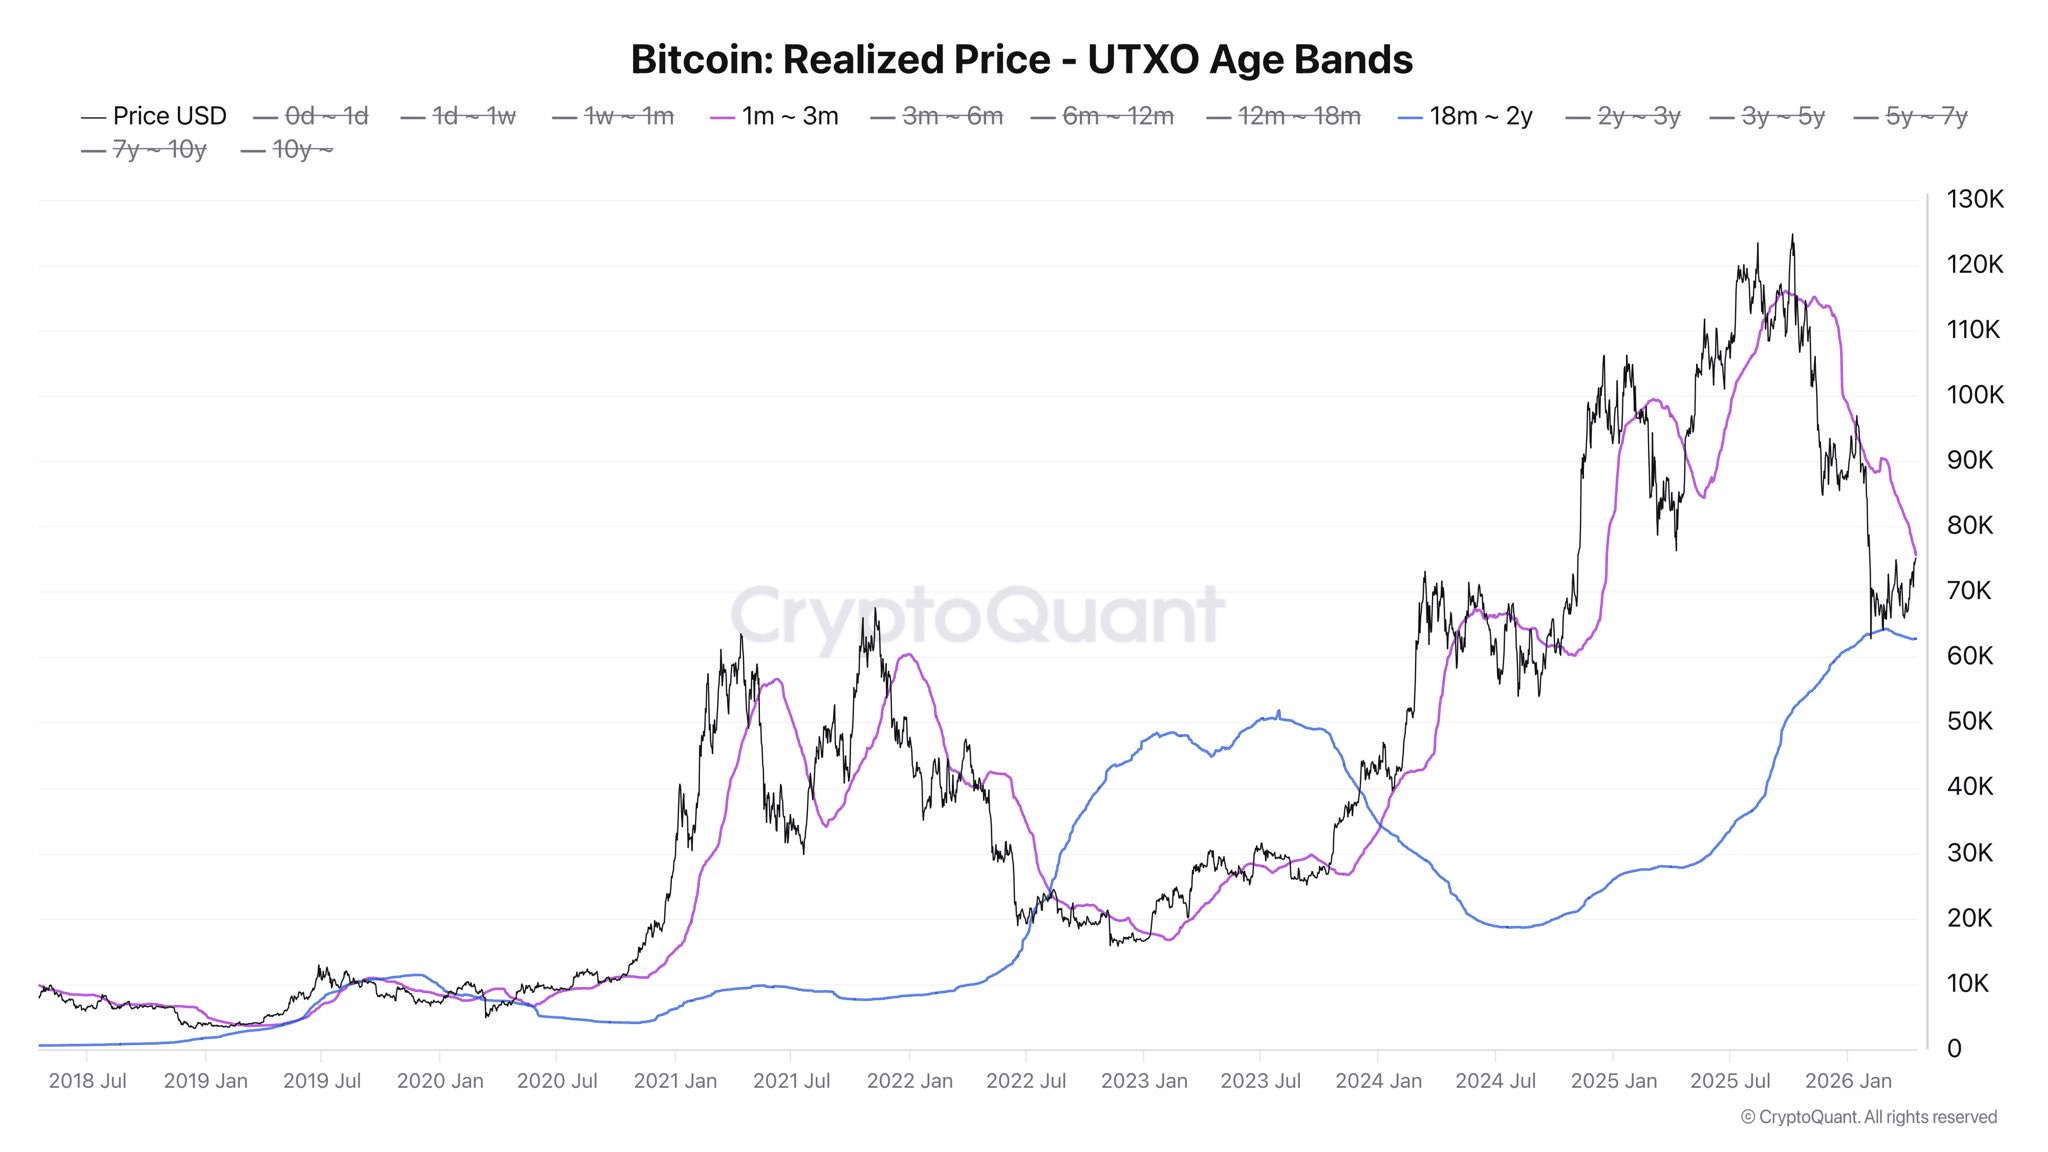
The logic here is very simple: STHs are usually the first to sell when Bitcoin trades above their cost price to lock in profits.
And this time, although BTC is only about 2.6% above this level, the profit-taking activity indicates that traders have begun to position themselves ahead of the potential resistance area near $80,000.
In this environment, many market participants prioritize preserving profits rather than risking a correction that could wipe out gains.
Therefore, to maintain the upward momentum, bulls need to absorb all this selling pressure; otherwise, the momentum could stall before BTC has a chance to break clearly above the $80,000 level.
Interestingly, the timing couldn't be better for Bitcoin bulls.
Increasing short Bitcoin positions could drive a short squeeze towards $80,000.
With actual profits continuing to accumulate, betting on Bitcoin's decline seems like a reasonable move.
Notably, Bitcoin's technical setup also supports this scenario. On the daily chart, BTC's RSI has climbed to its highest in three months, nearing 75.
This move comes after a nearly 10% increase in Bitcoin from the $70,000 level, a time when the RSI was still in the neutral zone. Simply put, BTC is now entering the overbought zone, a sign of strong momentum, but also a condition that increases the risk of a pullback in the short term.
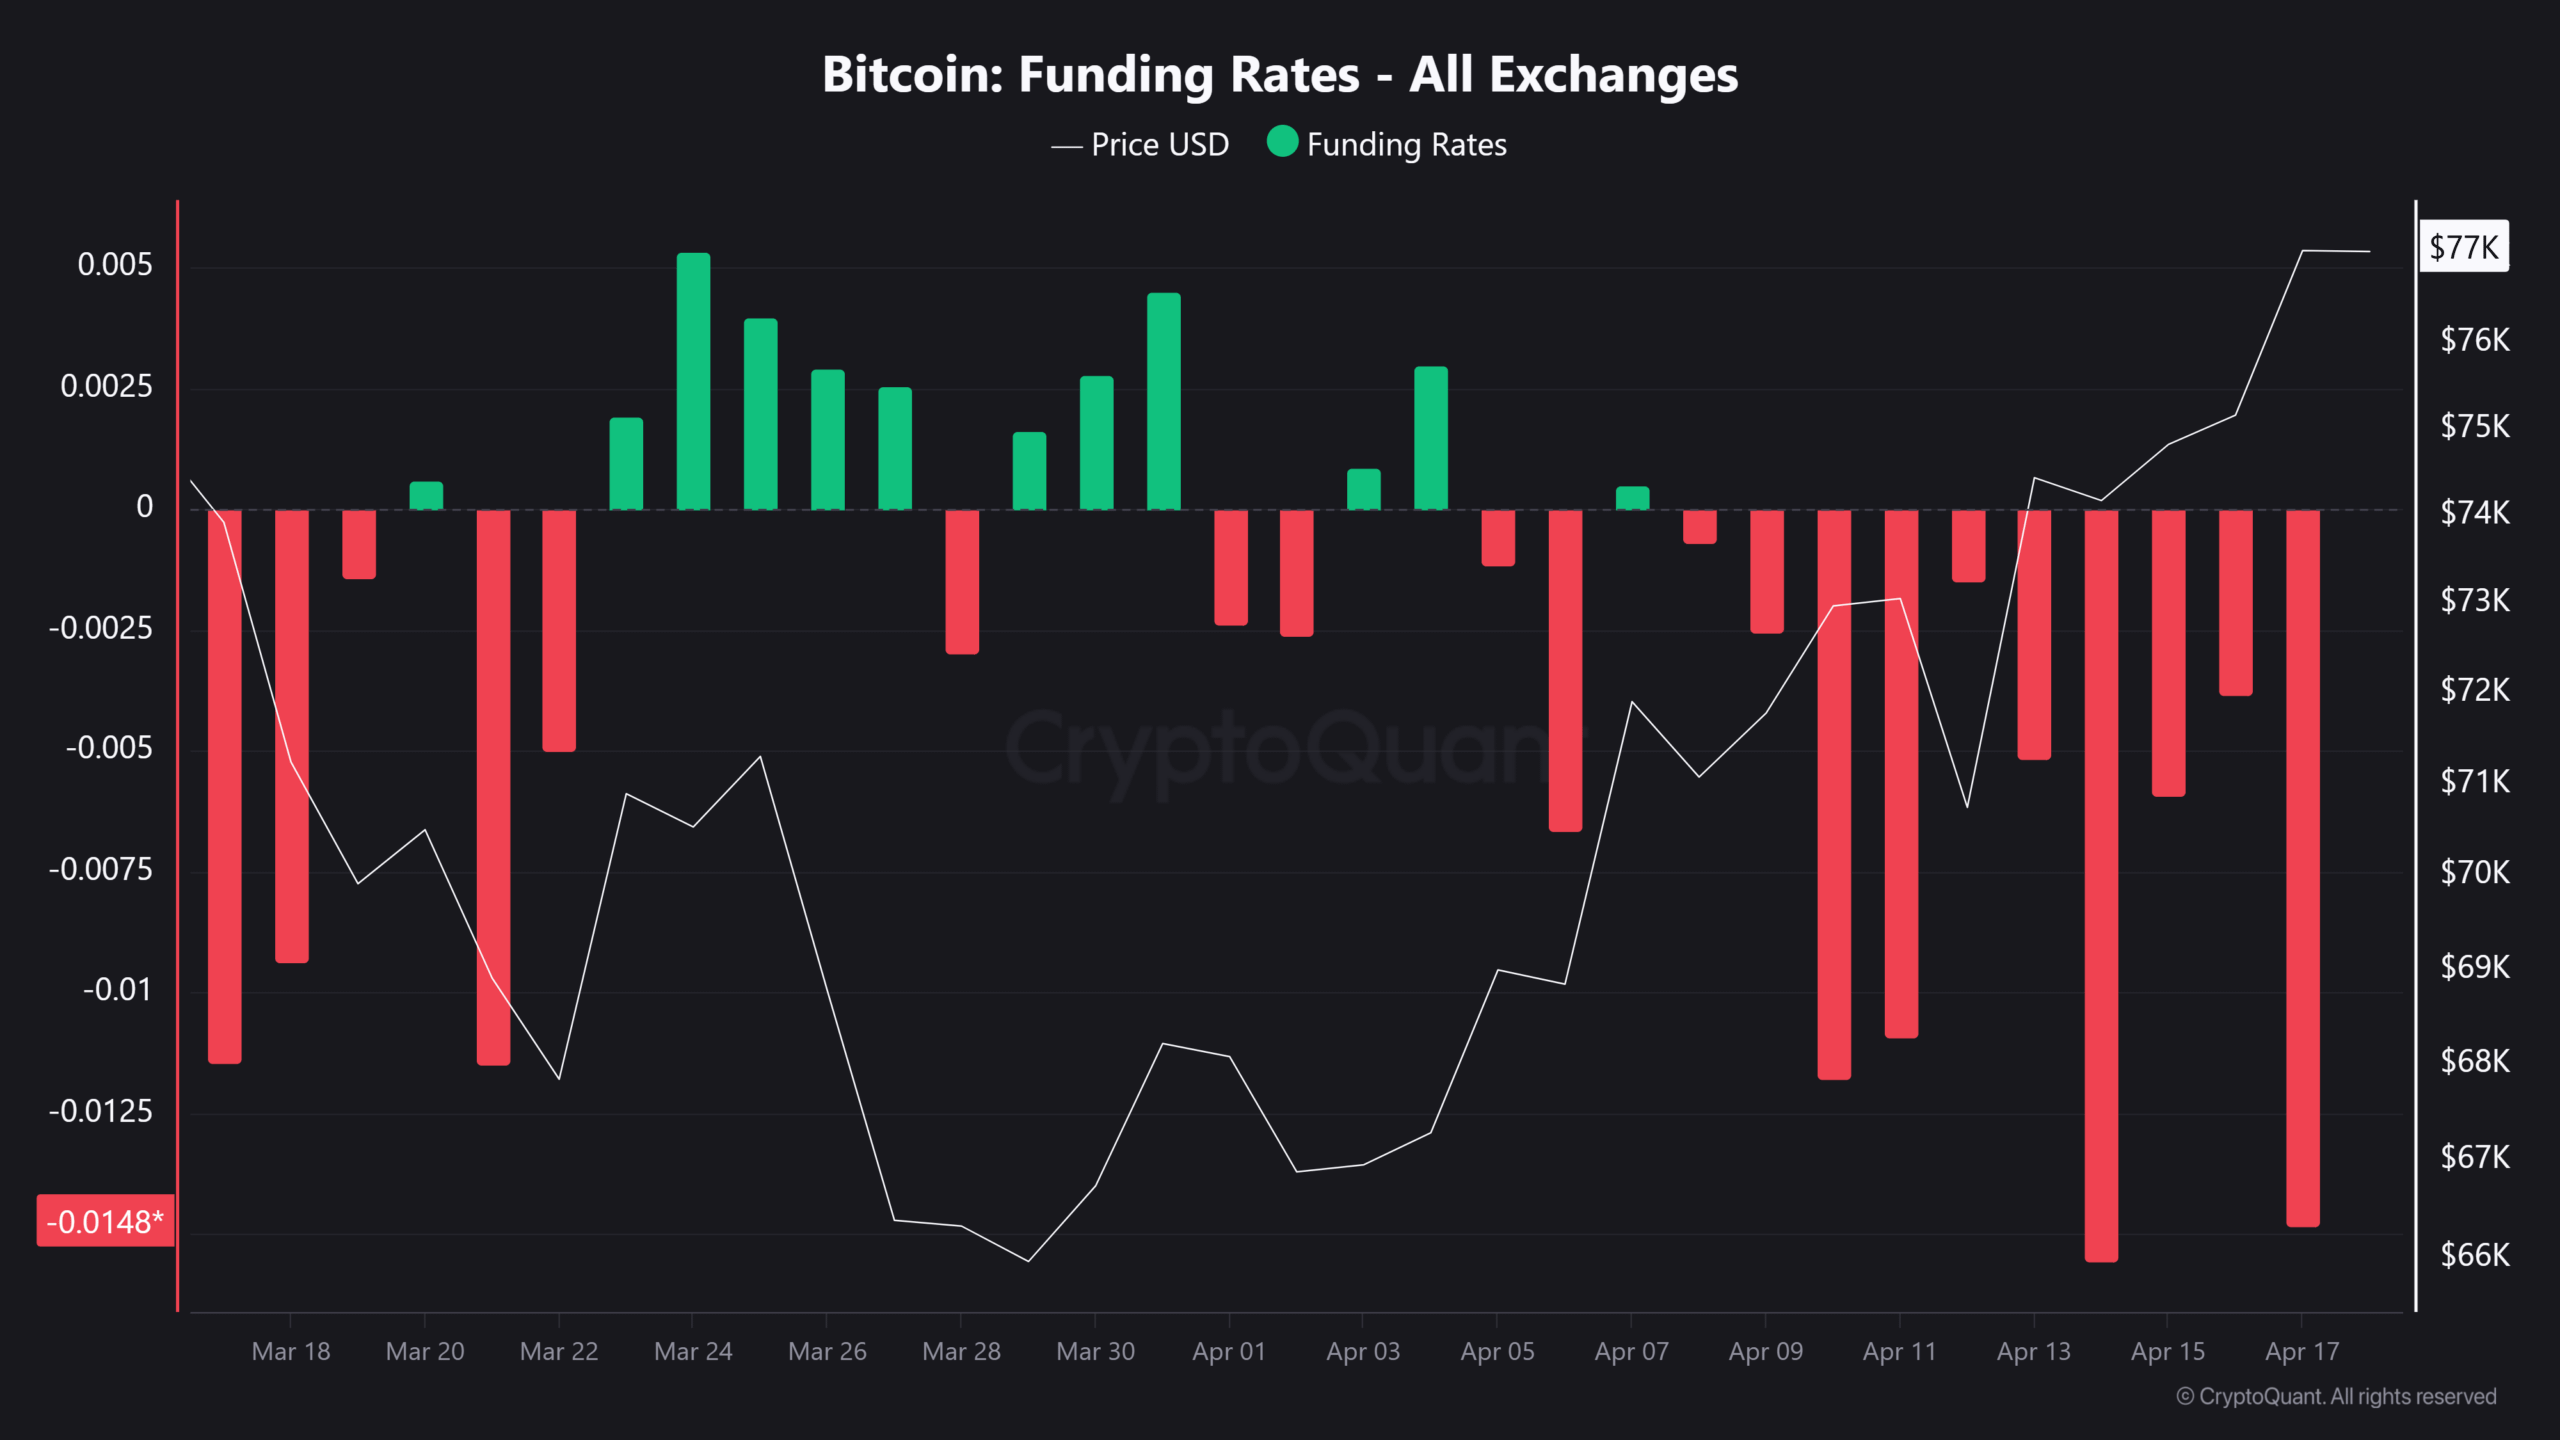
At the same time, short Bitcoin positions seem to be becoming more aggressive. As shown in the chart below, BTC's funding rates remain deeply negative.
In fact, the negative funding rate surged nearly 400%, dropping from -0.003 the day before to -0.0148 on April 17, just as BTC rose about 2.5% towards the $78,000 mark.
 Source: CryptoQuant
When combining factors: the RSI indicator being overbought, short-term holders taking profits, and the continuous funding rate being negative, this setup explains why betting on the current downtrend of Bitcoin seems reasonable, as bears are expecting resistance before a clean move above $80,000.
However, if bulls intervene and absorb the selling pressure, this setup could quickly turn into a 'bear trap'.
From an institutional perspective, over $650 million has recently flowed into Bitcoin ETF funds, with BlackRock's IBIT fund accounting for nearly 45% of the total inflow.
Along with the positive Coinbase Premium Index (CPI), this indicates that buying support is still present beneath the market. If risk appetite remains high, BTC pushing above $80,000 due to a short squeeze seems increasingly likely at this moment.
https://coinphoton.com/bitcoin-sth-chot-loi-dieu-chinh-hay-mot-dot-ban-non-kich-ban-nao-cho-tuong-lai.html