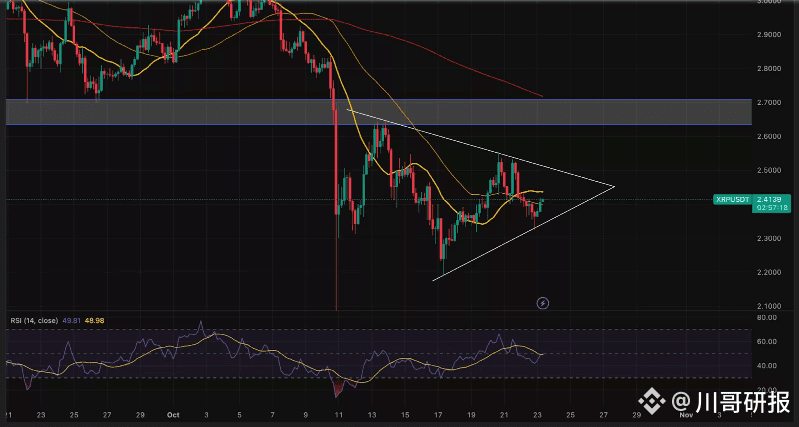
XRP Interpretation:
1. Technical Analysis
Currently, XRP is in a key consolidation phase, with the chart forming a symmetrical triangle pattern, reflecting a temporary balance between bulls and bears, and also indicating that a breakout is near. Short-term technical signals show a positive inclination: the 20-day Simple Moving Average (SMA) has crossed above the 50-day SMA, forming a 'golden cross', which is an early signal that the trend may turn bullish, and the price is currently stabilizing around the key support level of $2.40, indicating that buyers are gradually stepping in. On the resistance side, $2.45-$2.50 is the primary pressure zone in the short term, and once broken, it will face strong resistance at $2.70 (this level has transformed from the previous support after the crash on October 10, exerting strong pressure); on the support end, if the price falls below $2.40, the next key support will be $2.30. If the closing price drops below this level, the bullish structure will fail, likely triggering a pullback to $2.10. In terms of momentum indicators, the Relative Strength Index (RSI) hovers around 49 in the neutral zone, with no signs of overbought or oversold conditions. Whether subsequent trading volume can cooperate with directional breakouts will become the core basis for trend confirmation — a volume breakout above resistance will strengthen bullish signals, while a volume pullback breaking support will increase bearish risks.
2. Operational Suggestions
Bullish Strategy: If XRP breaks out of the $2.45-$2.50 range with volume (daily trading volume exceeds the average of the last 3 days by more than 30%), a small position can be taken. The first target is to look towards the resistance level of $2.70. After breaking through, an appropriate increase in position can be made, with a stop-loss set below the breakout level at $2.38 (to avoid false breakout risks). If the price retraces and finds support near $2.40 and the RSI does not break 45, a small position can also be tried for a long, with a stop-loss reference at $2.30.
Bearish Strategy: Only when the closing price is below $2.30 and accompanied by increased trading volume, a small position can be taken for a short, targeting $2.10, with a stop-loss set at $2.35 (to prevent being caught in a rebound). If the $2.30 support is not broken, blindly shorting is not recommended to avoid counter-trend operations.
Risk Warning: Currently in a sensitive stage before the triangle breakout, if continuous shrinking volume occurs (trading volume declines by more than 50% compared to the average of the last 3 days), new positions should be paused while waiting for a clear breakout signal; during the holding process, closely monitor the gains and losses of the $2.70 resistance and $2.30 support. Once key price levels are breached, adjust positions in a timely manner to control risk exposure.
1. Technical Analysis
Currently, XRP is in a key consolidation phase, with the chart forming a symmetrical triangle pattern, reflecting a temporary balance between bulls and bears, and also indicating that a breakout is near. Short-term technical signals show a positive inclination: the 20-day Simple Moving Average (SMA) has crossed above the 50-day SMA, forming a 'golden cross', which is an early signal that the trend may turn bullish, and the price is currently stabilizing around the key support level of $2.40, indicating that buyers are gradually stepping in. On the resistance side, $2.45-$2.50 is the primary pressure zone in the short term, and once broken, it will face strong resistance at $2.70 (this level has transformed from the previous support after the crash on October 10, exerting strong pressure); on the support end, if the price falls below $2.40, the next key support will be $2.30. If the closing price drops below this level, the bullish structure will fail, likely triggering a pullback to $2.10. In terms of momentum indicators, the Relative Strength Index (RSI) hovers around 49 in the neutral zone, with no signs of overbought or oversold conditions. Whether subsequent trading volume can cooperate with directional breakouts will become the core basis for trend confirmation — a volume breakout above resistance will strengthen bullish signals, while a volume pullback breaking support will increase bearish risks.
2. Operational Suggestions
Bullish Strategy: If XRP breaks out of the $2.45-$2.50 range with volume (daily trading volume exceeds the average of the last 3 days by more than 30%), a small position can be taken. The first target is to look towards the resistance level of $2.70. After breaking through, an appropriate increase in position can be made, with a stop-loss set below the breakout level at $2.38 (to avoid false breakout risks). If the price retraces and finds support near $2.40 and the RSI does not break 45, a small position can also be tried for a long, with a stop-loss reference at $2.30.
Bearish Strategy: Only when the closing price is below $2.30 and accompanied by increased trading volume, a small position can be taken for a short, targeting $2.10, with a stop-loss set at $2.35 (to prevent being caught in a rebound). If the $2.30 support is not broken, blindly shorting is not recommended to avoid counter-trend operations.
Risk Warning: Currently in a sensitive stage before the triangle breakout, if continuous shrinking volume occurs (trading volume declines by more than 50% compared to the average of the last 3 days), new positions should be paused while waiting for a clear breakout signal; during the holding process, closely monitor the gains and losses of the $2.70 resistance and $2.30 support. Once key price levels are breached, adjust positions in a timely manner to control risk exposure.