

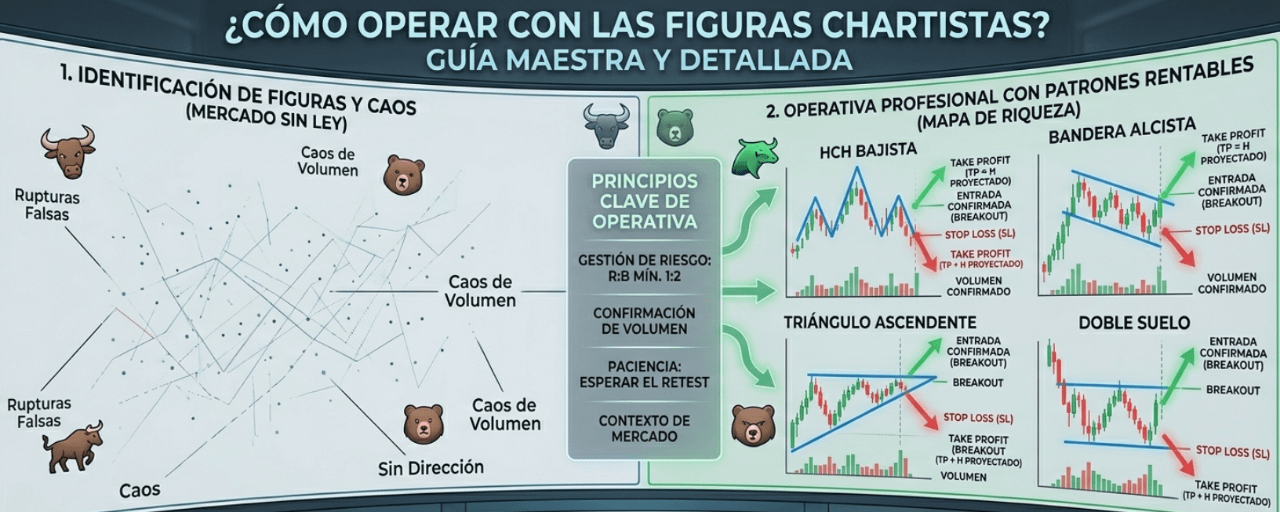

Welcome to the fascinating world of Chartism and market analytics. I’ll tell you that chart patterns are not random drawings; they are the visual representation of mass psychology. Fear, greed, and indecision are the traces left by whales and institutions before they devour the little fish—and we are going to learn to read them.
Here’s a definitive guide to mastering the art of chart analysis. I hope it’s very useful to you. Remember to save this article so you always have this information at hand. Share this knowledge with other Binance users—don’t keep this treasure to yourself.
1. Identification of Chart Patterns
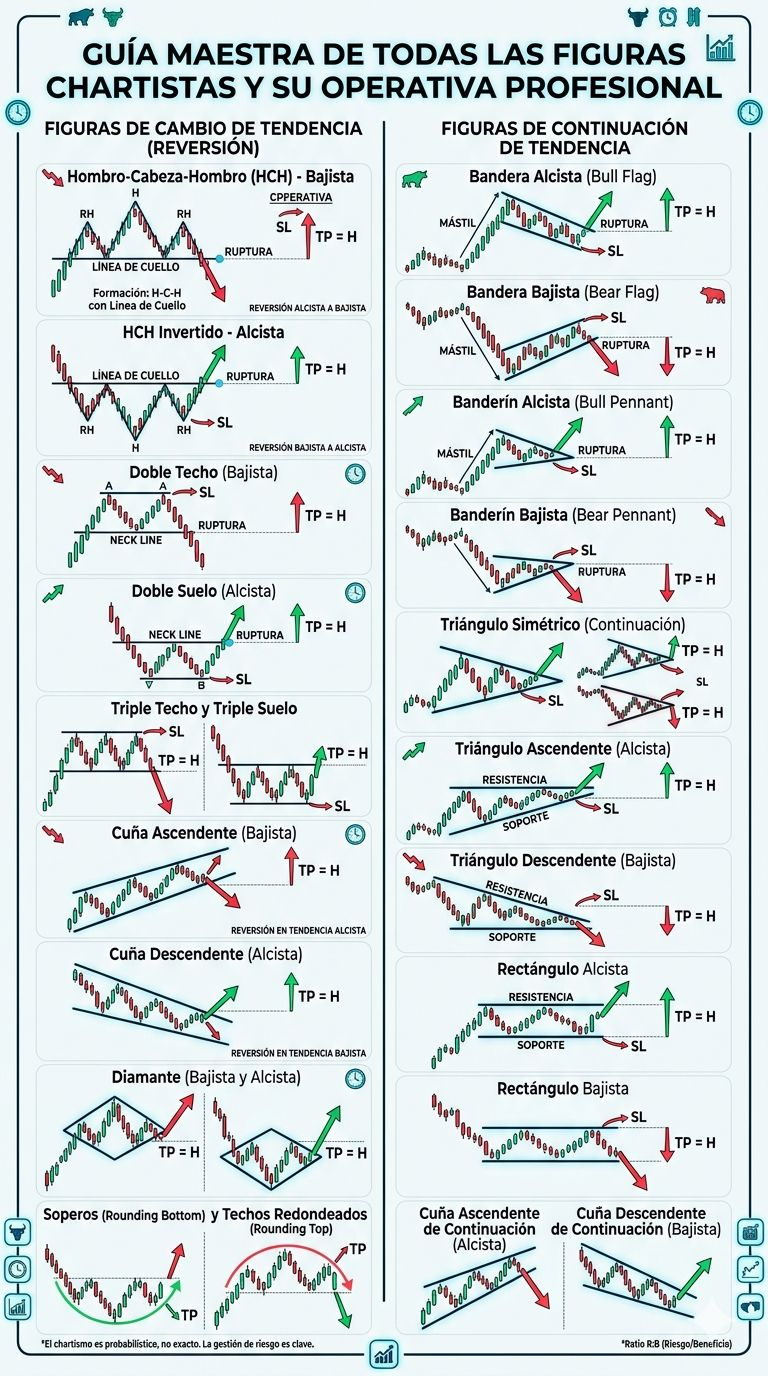
Objective: Understand that patterns are capital accumulation or distribution structures that precede an important move.
Patterns are divided into two large families:
Reversal (Change of Trend): They indicate that the current trend is exhausted and the price will turn.
Continuing: They indicate that the market is taking a "breather" before continuing in the same direction.
How to identify them:
Look for contact points: A valid pattern needs at least two or three touches on its support or resistance lines.
Volume is your best friend: Generally, volume decreases while the pattern is forming and spikes when it breaks.
2. The Trend Break (Breakout)
Objective: Locate the exact point where the balance between supply and demand breaks so you can enter the market.
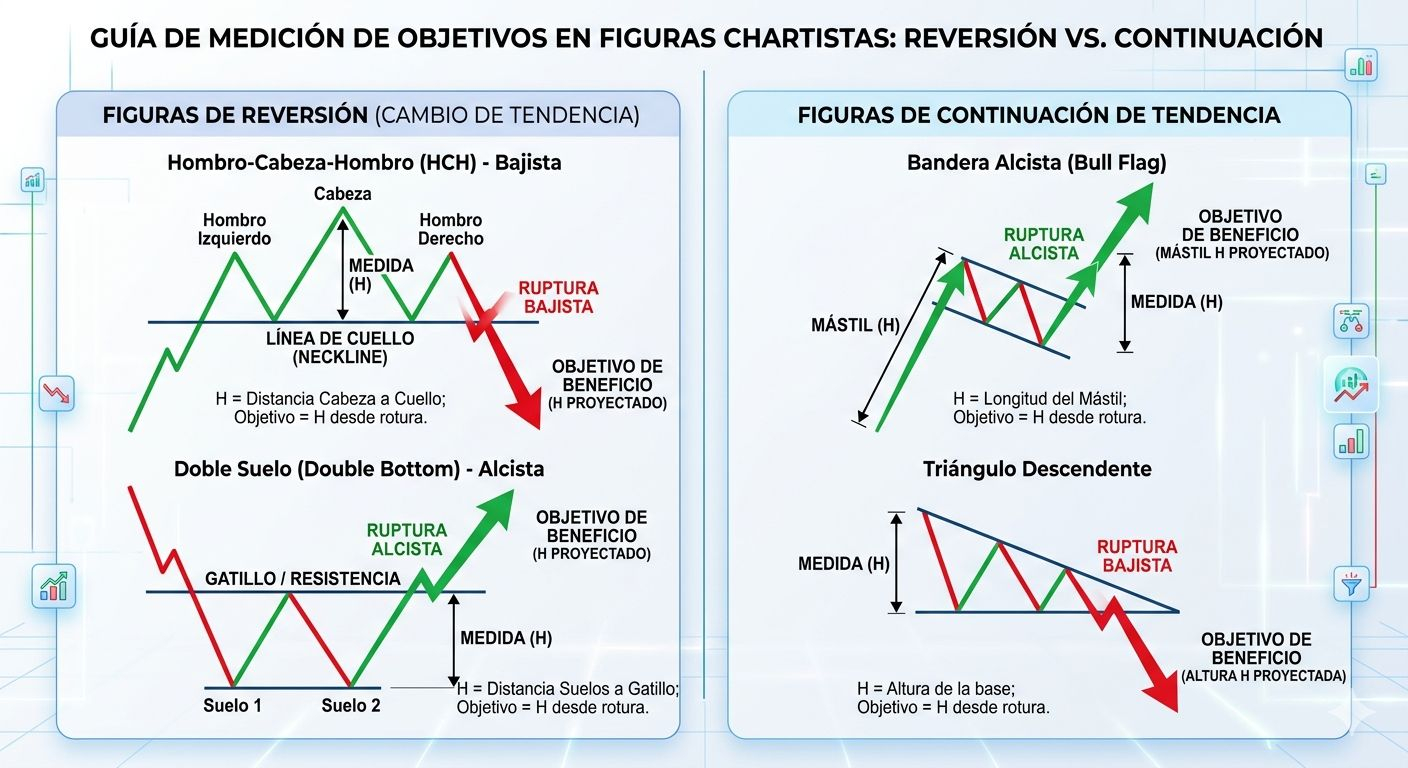
A breakout happens when the price strongly crosses a support or resistance level that the pattern was containing.
How to identify a real breakout:
Breakout candle: The candle that breaks must close outside the pattern, preferably with a large body.
Volume increase: If the price breaks but the volume is low, be cautious; it could be a "trap" (fakeout).
The Pullback (or Retest): Many times, after breaking out, the price comes back to touch the line it broke (now turned into support if it was resistance, or vice versa) before taking off. This is the safest entry point.
3. The best chart patterns (Top 3)
Objective: Master the patterns with the highest statistical success rate.
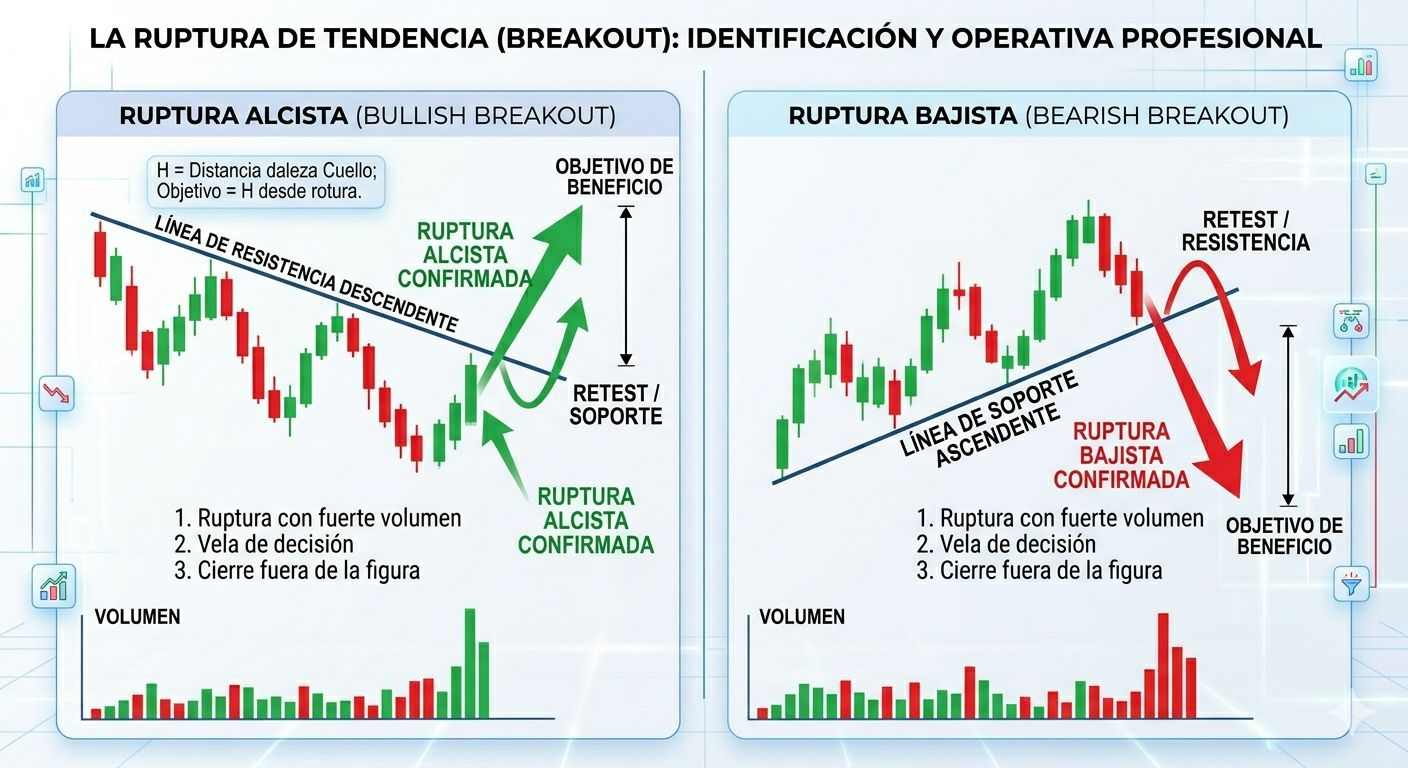
A. Head and Shoulders (HCH) - Reversal
It’s the queen of reversal patterns. It indicates that buyers no longer have the strength to push the price to new highs.
Trading: You enter when the price breaks the "neckline". The profit target is the distance from the head to the neckline projected downward.
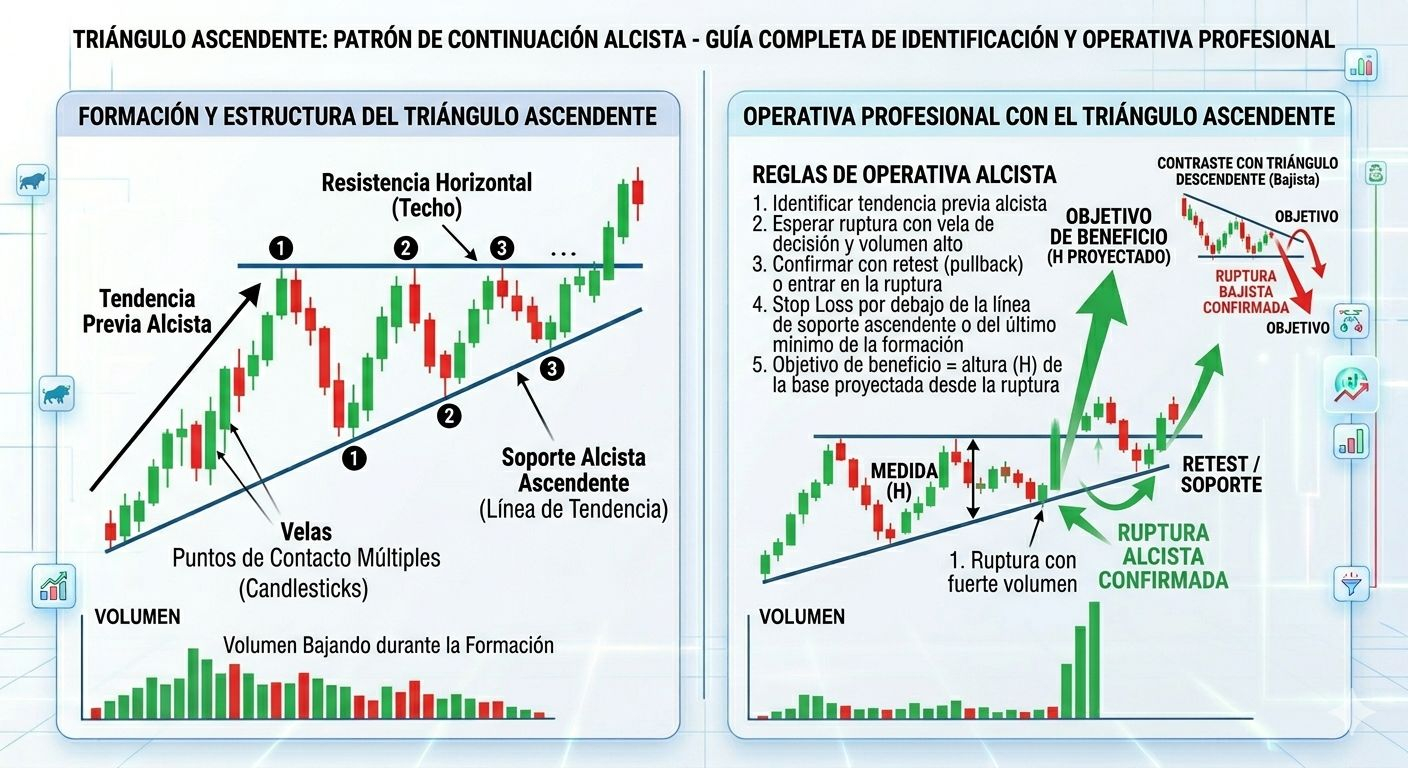
B. Ascending Triangle - Continuation
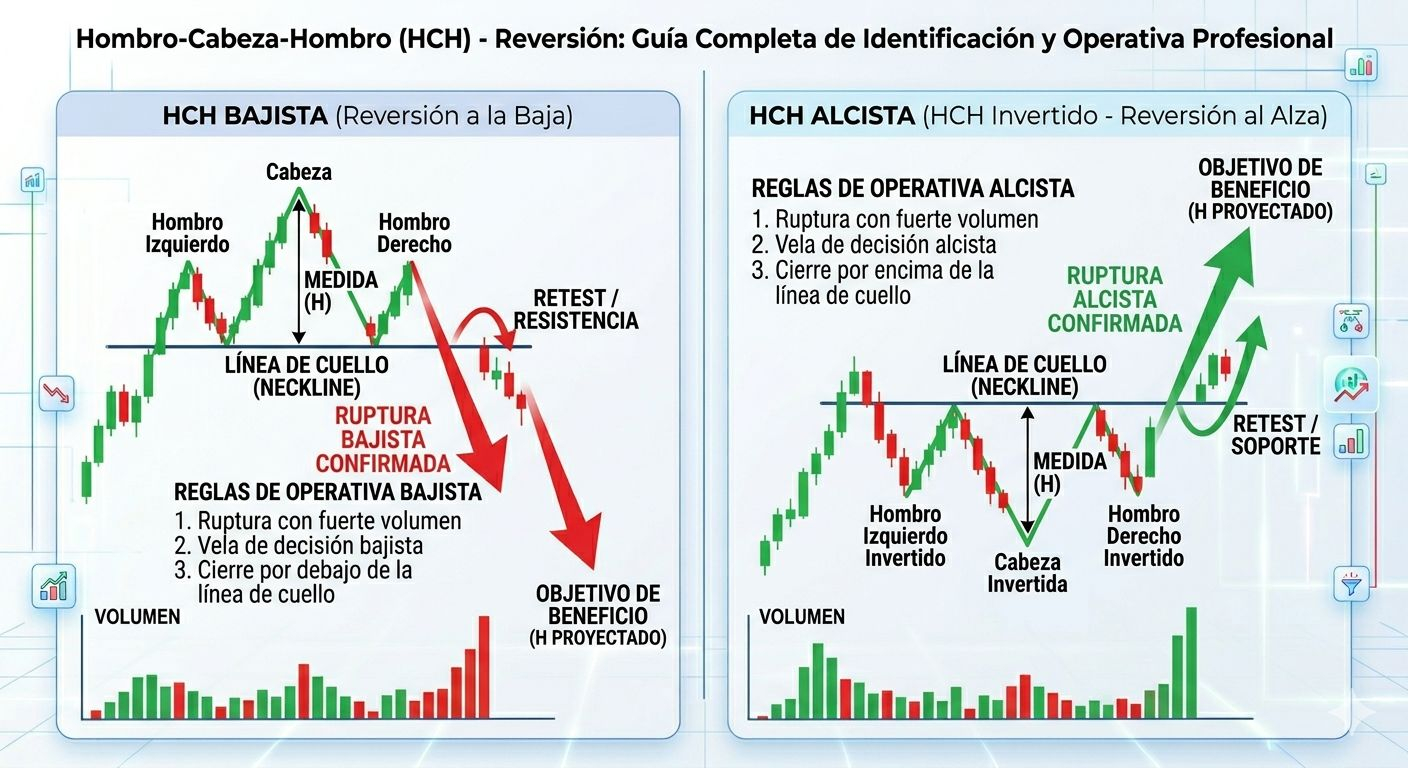
A flat horizontal resistance and an upward support line. It indicates that buyers are pressing harder and harder.
Trading: Enter on the break of the upper resistance. The target is the height of the triangle’s base.
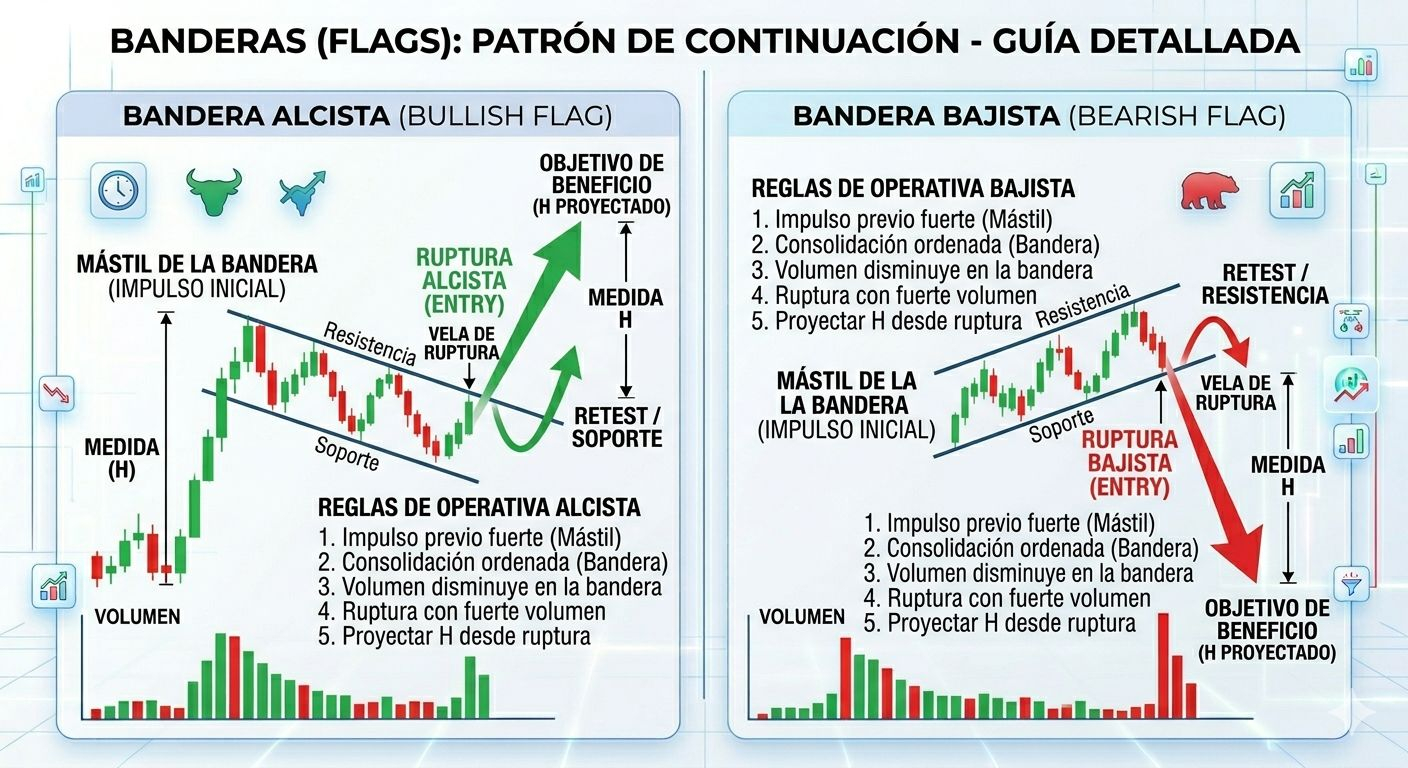
C. Flags - Continuation
They are small consolidations against the trend after an explosive move (the "mast"). They are extremely reliable in markets with strong momentum.
Trading: Enter when the price breaks the flag channel in the direction of the previous trend.
4. How to trade with chart patterns?
Objective: Establish a professional trading methodology based on rules, not on guesses.
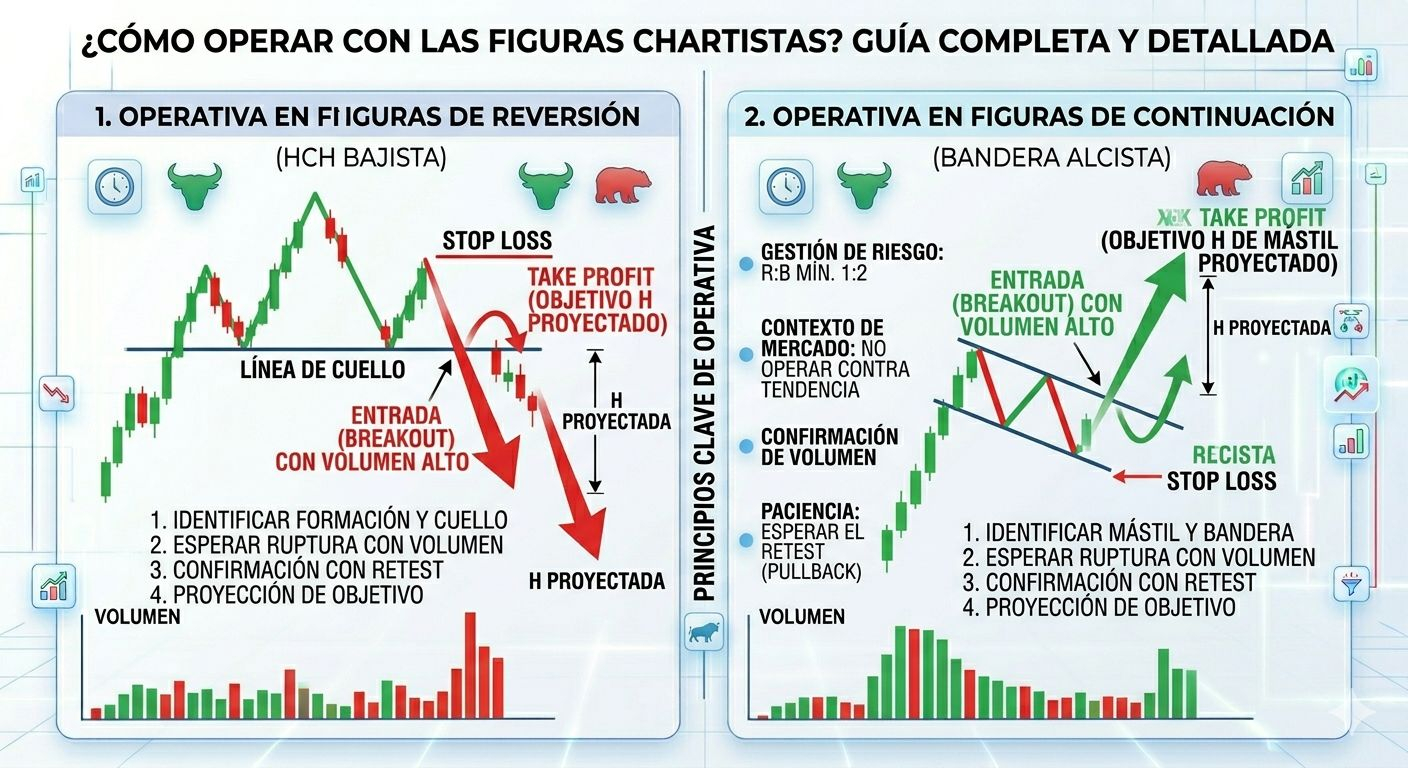
For each trade, you must define three critical points:
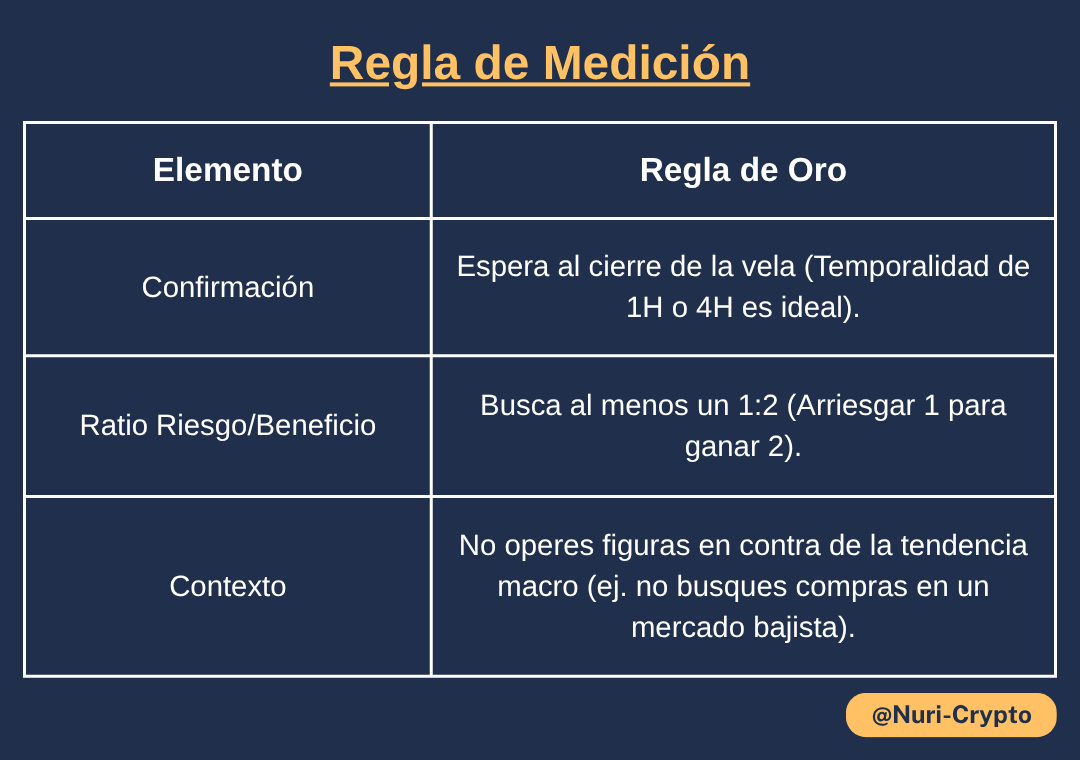
Entry (Entry): Don’t anticipate. Enter when the candle closes outside the pattern or during the pullback.
Stop Loss (Protection): Always place it inside the pattern. If the price moves back into the pattern deeply, then the pattern has failed.
Take Profit (Target): Use the measurement rule. Measure the height of the pattern and project it from the breakout point.
A Tip: Chartism is not an exact science; it’s a probabilistic game. Patterns give you a statistical edge, but you must always pair them with impeccable risk management. Remember: the market can do anything, but patterns tell you what it will likely do.
⚠️ Important: Trading involves significant risk. This article is educational and does not constitute financial advice.
Did this guide help clarify your market view?
Give a LIKE if you learned something new today.
COMMENT "PATTERN" and tell me which setup resists you the most so I can explain it in the next post.
SHARE with that friend who keeps buying at the highs due to FOMO.
Did I save you from a Stop Loss today?
If this content gave you real value and you want to support the creation of in-depth and free analyses, consider making a donation. Your support keeps this analytics engine running at full power.
💎 Donations down here ⬇️⬇️⬇️
Buy me a coffee! ☕
🔥 I invite you to our public group:
!Trading’s Fantastics! 🔥🚀💵
May the trend’s strength be with you! 🔥💚🔥
See you on the charts, and may the trend be with you! 🔥💚🔥
#trading #Binance #EducaciónCripto #nuricrypto


