《10.23 Bitcoin Market Analysis and Trading Strategy》
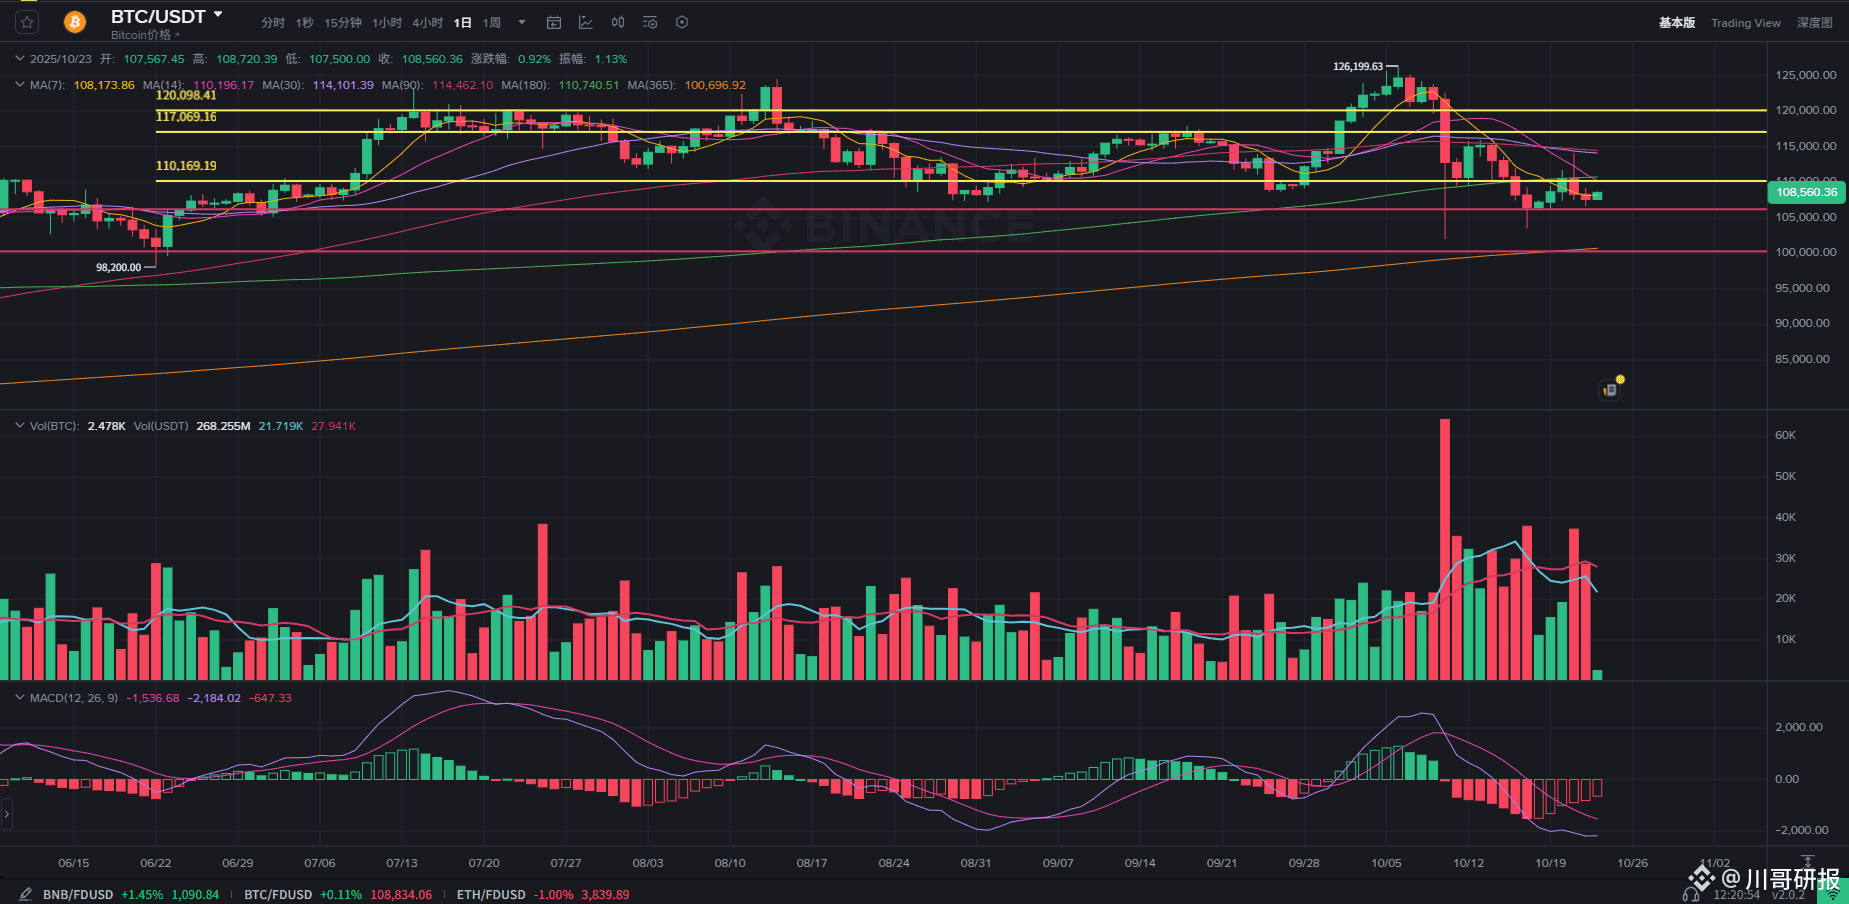
Currently, BTC is in a phase of adjustment within a medium-term upward trend. This round of adjustment essentially belongs to the process of confirming support through a pullback. Observing from the weekly level, there are no signs of a break in the overall upward channel trend. In the daily cycle, although the market showed an increase in volume in the first two trading days, it did not accompany a significant decline. This phenomenon indicates that funds at low levels have begun to gradually enter the market. However, during the subsequent rebound process, the trading volume has shown a significant contraction, which also means that the bullish camp has not yet gathered a unified upward momentum, and the short-term market still lacks strong driving force.
In terms of structural patterns, the current BTC trend has initially shown characteristics of a “W bottom formation,” with the neckline position roughly located at the 110,000 USD level. According to technical logic, if the subsequent trading can effectively increase in volume and break through this neckline, it can be regarded as a key signal of a phase stop-loss, and the subsequent market is likely to initiate a rebound trend.
Looking at the MACD technical indicator, this indicator is currently operating below the 0 axis, but the fast and slow line trends have gradually become flat, while the negative value scale of the indicator histogram is gradually shortening. These signals indicate that the current market's bearish momentum is in a continuous decline, and the comparison of bullish and bearish forces is slowly changing.
For the future market direction, in the short term (1-3 days), BTC is likely to oscillate within the 107,000 - 110,000 USD range. During this period, it is important to pay close attention to whether the market can release effective trading volume, thus breaking the current range oscillation pattern and clarifying the next breakout direction.
In terms of intraday trading strategy, the focus should be on the support strength of the 107,300 - 106,300 USD range. If the price pulls back to this range and shows stabilization signals, potential bullish opportunities can be seized; on the upper side, attention should be paid to the pressure situation of the 109,300 - 110,300 USD range. Whether this range can be broken will directly affect the intraday market's rebound height.
Currently, BTC is in a phase of adjustment within a medium-term upward trend. This round of adjustment essentially belongs to the process of confirming support through a pullback. Observing from the weekly level, there are no signs of a break in the overall upward channel trend. In the daily cycle, although the market showed an increase in volume in the first two trading days, it did not accompany a significant decline. This phenomenon indicates that funds at low levels have begun to gradually enter the market. However, during the subsequent rebound process, the trading volume has shown a significant contraction, which also means that the bullish camp has not yet gathered a unified upward momentum, and the short-term market still lacks strong driving force.
In terms of structural patterns, the current BTC trend has initially shown characteristics of a “W bottom formation,” with the neckline position roughly located at the 110,000 USD level. According to technical logic, if the subsequent trading can effectively increase in volume and break through this neckline, it can be regarded as a key signal of a phase stop-loss, and the subsequent market is likely to initiate a rebound trend.
Looking at the MACD technical indicator, this indicator is currently operating below the 0 axis, but the fast and slow line trends have gradually become flat, while the negative value scale of the indicator histogram is gradually shortening. These signals indicate that the current market's bearish momentum is in a continuous decline, and the comparison of bullish and bearish forces is slowly changing.
For the future market direction, in the short term (1-3 days), BTC is likely to oscillate within the 107,000 - 110,000 USD range. During this period, it is important to pay close attention to whether the market can release effective trading volume, thus breaking the current range oscillation pattern and clarifying the next breakout direction.
In terms of intraday trading strategy, the focus should be on the support strength of the 107,300 - 106,300 USD range. If the price pulls back to this range and shows stabilization signals, potential bullish opportunities can be seized; on the upper side, attention should be paid to the pressure situation of the 109,300 - 110,300 USD range. Whether this range can be broken will directly affect the intraday market's rebound height.