


In the past few days of Bitcoin stabilization, the altcoin season has seen a long-awaited sharp fluctuation.
Tokens with a market capitalization of less than twenty million dollars have tripled, quintupled, and some are close to ten times within a few days. There has been no significant progress, no ecological breakthroughs, and no new institutions entering the market, yet the prices have been pushed up like this.
This phenomenon has a ready-made explanation: altcoins are high Beta assets; when Bitcoin rises, altcoins run even faster. This statement holds statistically, but it cannot fully explain the situation. High Beta can explain why altcoins increase more than Bitcoin, but it cannot explain why the increase is several times greater. This multiple comes from another matter.
The altcoin season index is currently 34, and BTC dominance is 58.5%. Both numbers tell you that this market is still quite far from a true altcoin season. Yet in this market without an altcoin season, certain tokens are moving with the amplitude typical of an altcoin season.
From December 2024 to April 2026, the total market capitalization of altcoins excluding Bitcoin and Ethereum shrank from a peak of about $1.16 trillion to about $700 billion, evaporating nearly 40%. When the market cap shrinks to a sufficiently low level, the rules change; prices are no longer determined by market consensus but by who holds enough chips.
This is a loophole created by overselling, not a signal emitted by a bull market.
Altcoins have indeed dropped too much.
In the blockchain field, there is the concept of a 51% attack; controlling more than half of the network's computing power allows one to alter records, double-spend tokens, and rewrite history. The capital version of this logic is simpler: it doesn't require technology or computing power, just money. In this round, the altcoin market has evaporated nearly 40% of its market cap, also lowering the entry threshold by 40%.
As of early April 2026, the total market capitalization of altcoins is about $700 billion, down about 40% from the peak of about $1.16 trillion in December 2024. If measured to the end of 2025, the decline is about 44%. The different time points for measuring the two thresholds have the same direction: the overall size of this market has approached a halving.
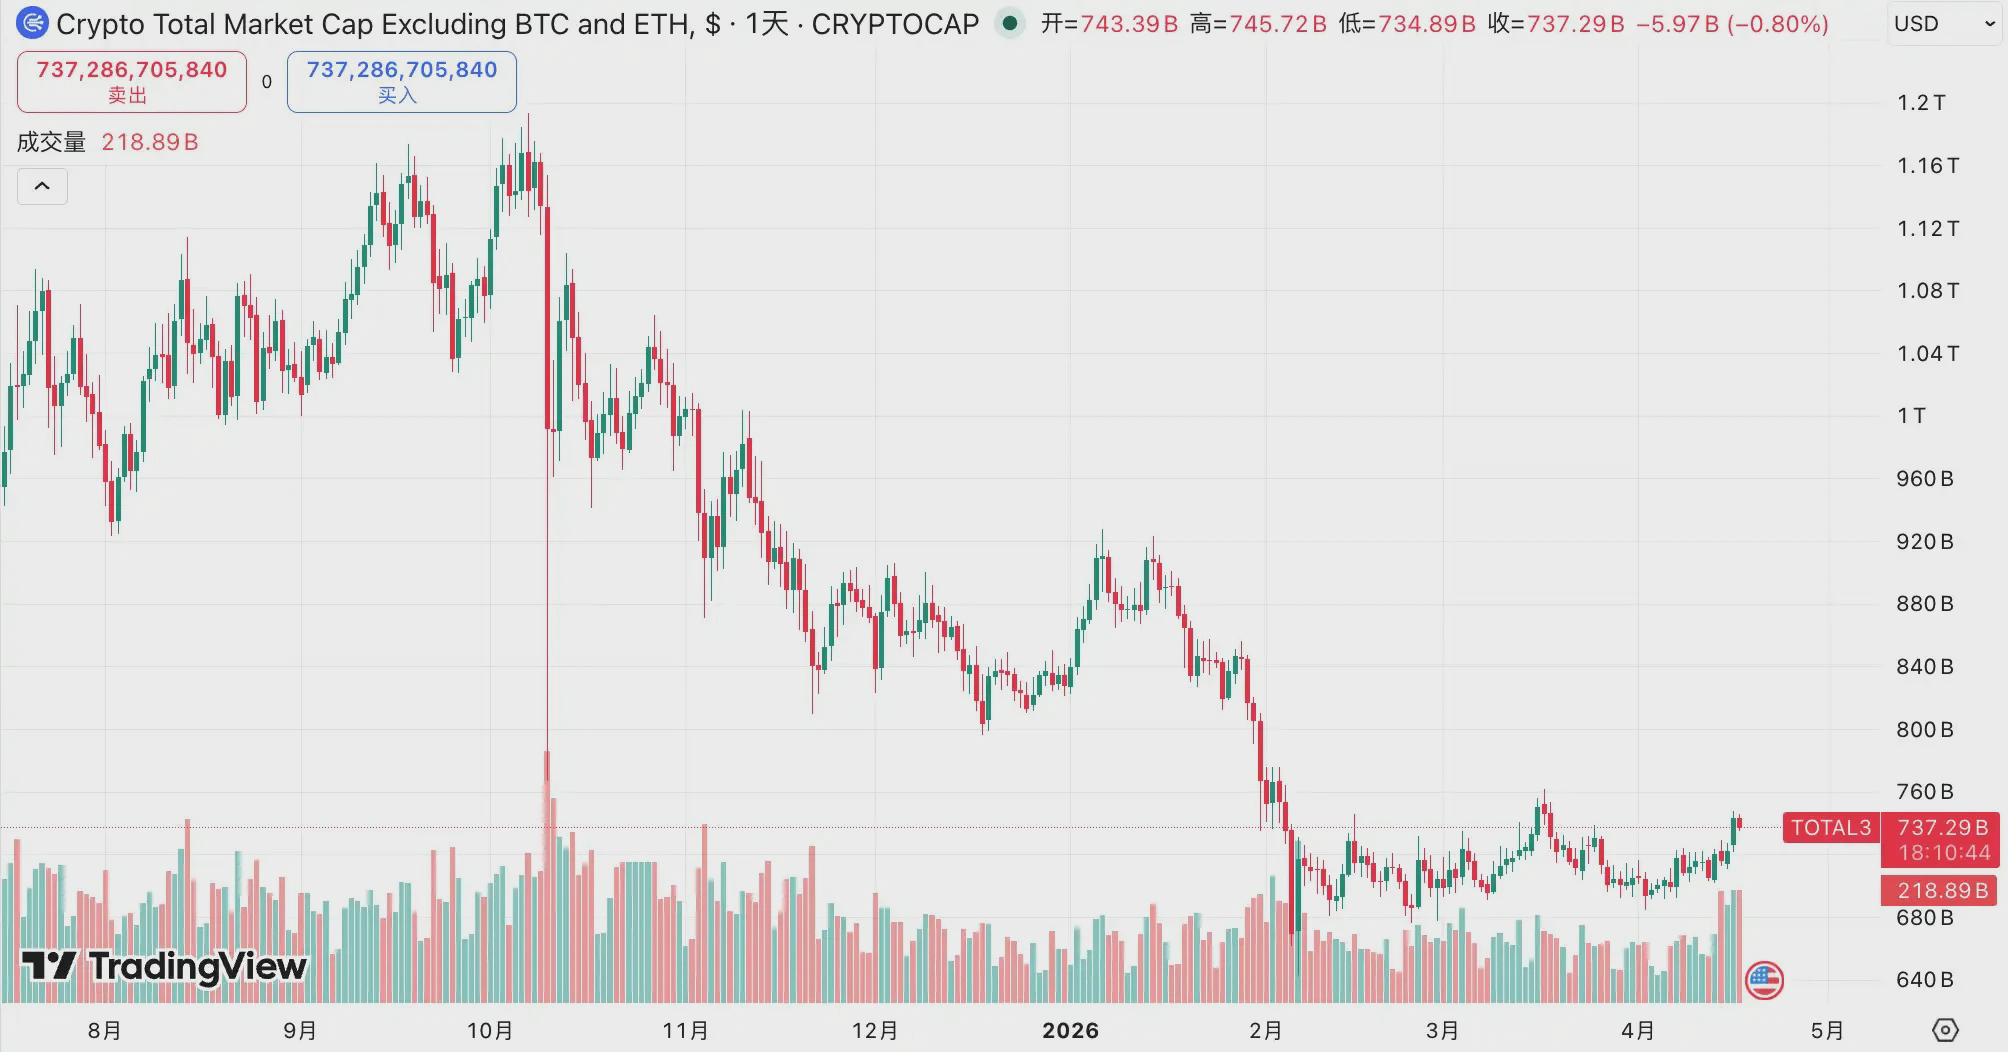
What does a halved market cap mean? Ten million dollars in a market with a circulating market cap of $500 million accounts for 2% of the circulation, while in a market with a circulating market cap of $50 million, it accounts for 20%. The threshold has been lowered tenfold, but the amount of money hasn't changed. After a sharp decline, the cost of controlling the market becomes calculable. To be calculable means it can be executed.
The recent surge of the SIREN token provides an analytical case. SIREN rapidly rose in late March, showing a noticeable upward trend. On March 24, on-chain analyst EmberCN issued a warning: an entity may have controlled up to 88% of SIREN's circulating supply, valued at about $1.8 billion at the time. As the news spread, SIREN fell from $2.56 to $0.79 on that day, a decline of over 70%. During the rapid price escape, almost no one could exit at a reasonable price because that price was never formed by the market.

Conservatively calculated, 48 wallets hold about 66.5% of circulating chips. Even at this minimum level, a very limited set of addresses has already met the structural conditions to control price direction. From the moment the price is formed, the symmetry of this game has already been broken. Retail investors, holding what they think is money for participating in free market transactions, have entered a container with a pre-set exit path.
SIREN is not an isolated case, nor is it a black swan; it is the norm for oversold altcoins structurally. The deeper the drop, the less money is needed, making it easier to be hijacked. Overselling is not a discount; it is fragility, and this round of overall market cap decline by 40% means this fragility has systematically expanded across the entire market.
Shorts are the fuel.
If the story only has this half, then the logic is one-sided: the market maker locks up chips, drives up prices, retail investors take over, and crash follows. But the market of super-small-cap altcoins usually has another layer of structure stacked on top, where shorts become the material that ignites.
During the rapid rise of SIREN's price, the funding rate reached -0.2989% every 8 hours, annualized at about -328%. Translated, this means that shorting SIREN and holding a position requires paying about 0.3% of the principal to the longs every 8 hours. Holding the position for a month, this cost alone can consume more than 25% of the principal, not counting the paper losses from price increases.
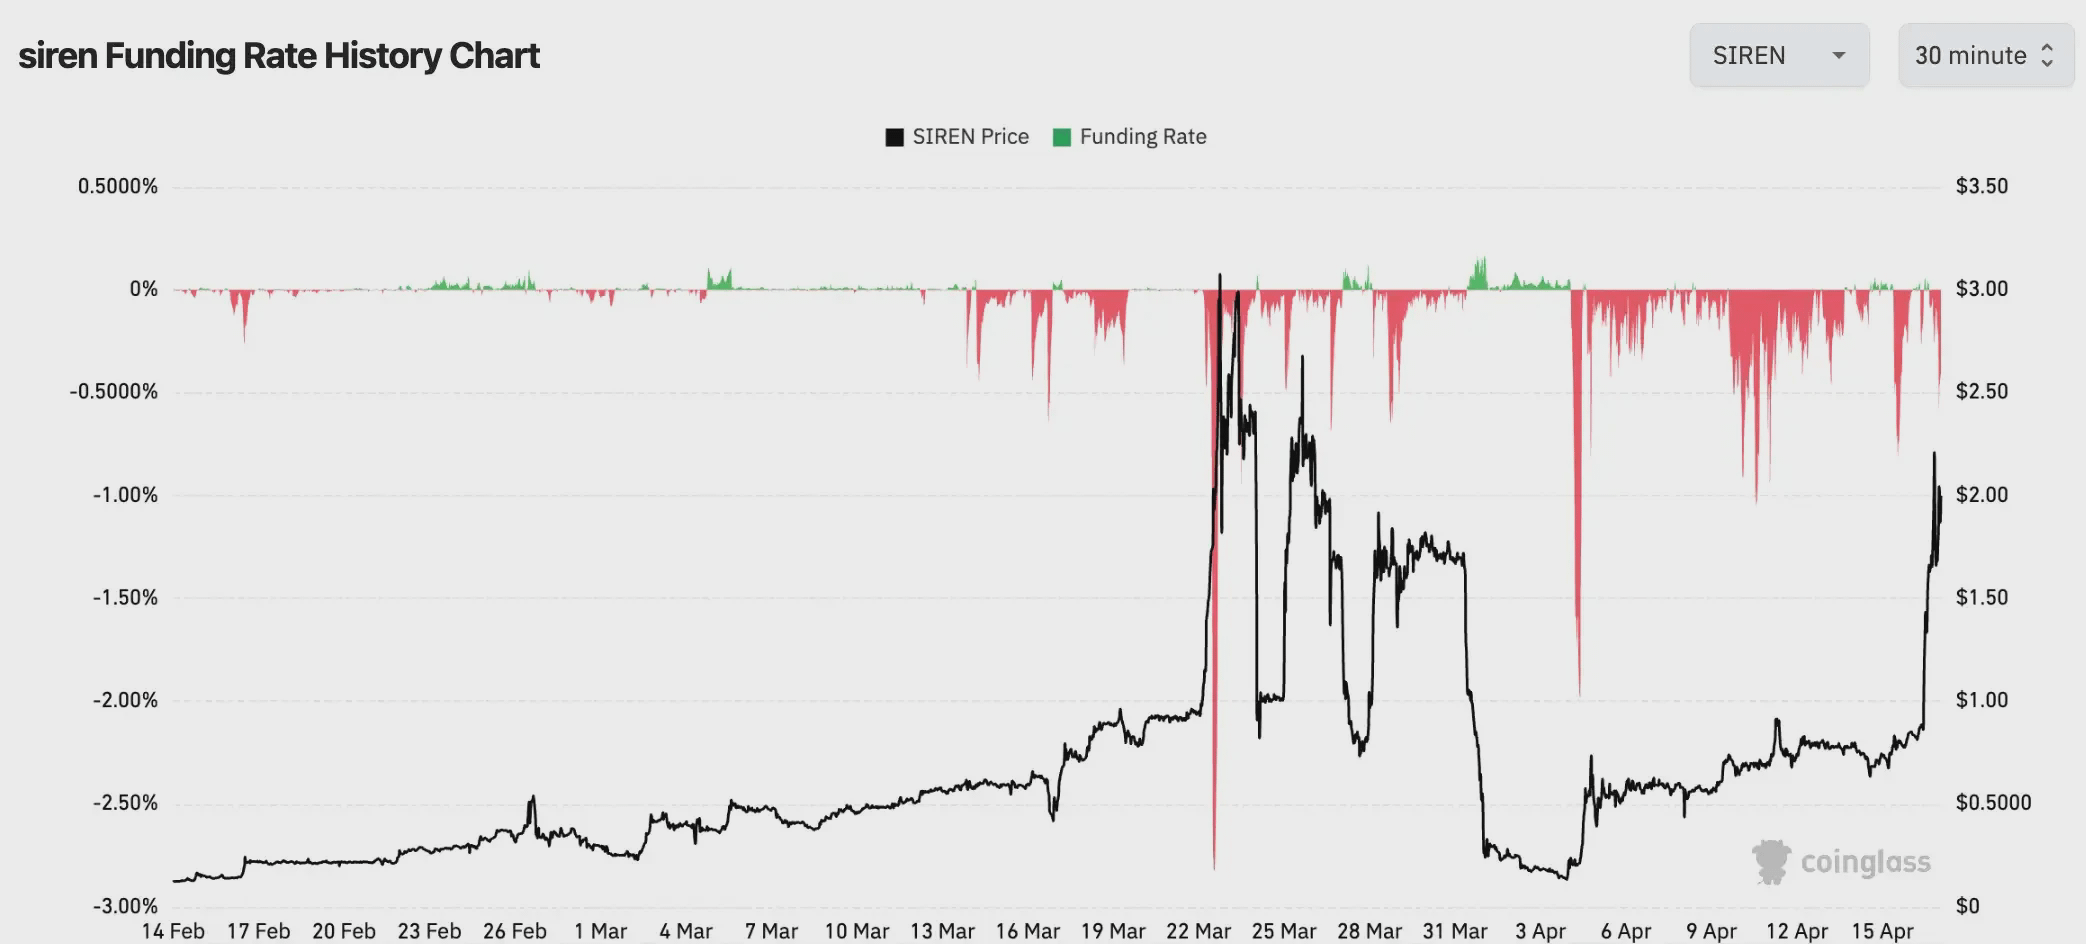
This number is not uncommon in the small-cap altcoin market. Some tokens saw funding rates drop to as low as -0.4579% every 8 hours during extreme market conditions, annualized at about -501%. At this level, short sellers face not the risk of wrong directional judgment, but the certainty of being slowly ground down by a machine. Even if the ultimate direction is correct, they will be exhausted before the right day arrives.
When you see an altcoin rise by 80% and decide to short it, every short position you take is paying interest to the long side. Meanwhile, if the price continues to rise and hits your liquidation line, the system will automatically buy at market price to close your position, and this forced buy further pushes up the price.
The chain of forced liquidation operates this way. Prices rise, shorts incur paper losses, and once those losses hit the forced liquidation line, the system automatically buys to close positions at market price. This buying further pushes up prices, triggering more shorts, leading to a new round of buying. In a thin liquidity small-cap market, every order can drive larger price movements, and the chain's transmission efficiency is much higher than that of large-cap assets.
Here lies an often-overlooked asymmetry. Someone who sees a token soaring 90% and decides to short it usually believes they are making a statistically correct judgment: 'It has risen so much, it must correct.' However, in a market locked by highly concentrated holdings, this judgment must contend not only with price direction but also with a funding cost of 0.3% of principal flowing out every 8 hours, and the chain reaction triggered by passive buying once the liquidation line is hit. This game has never been symmetric from the start.
Extreme negative funding rates are the dashboard readings of this machine. Shorts have accumulated, and ammunition is loaded; at this moment, acceleration is taking place, with the opposing group having only two choices: liquidate or chase high prices. Both choices fuel the price. This is not a rise formed by market consensus; it's a structurally designed one-sided consumption.
A bustling market without new money.
BSC chain's weekly DEX trading volume has increased by 97% year-on-year, the altcoin season index is 34/100, and BTC dominance is 58.5%. The three numbers can coexist and contradict each other at the same time.
The on-chain heat is indeed palpable, but the latter two numbers tell you that this market is still in 'Bitcoin season'; less than half of mainstream altcoins have outperformed Bitcoin, and dominant funds are highly concentrated in Bitcoin, far from spreading outward. However, the three numbers point to the same reality: this is stock funds accelerating circulation, not new money entering the market. The excitement is real, but excitement does not equal expansion.
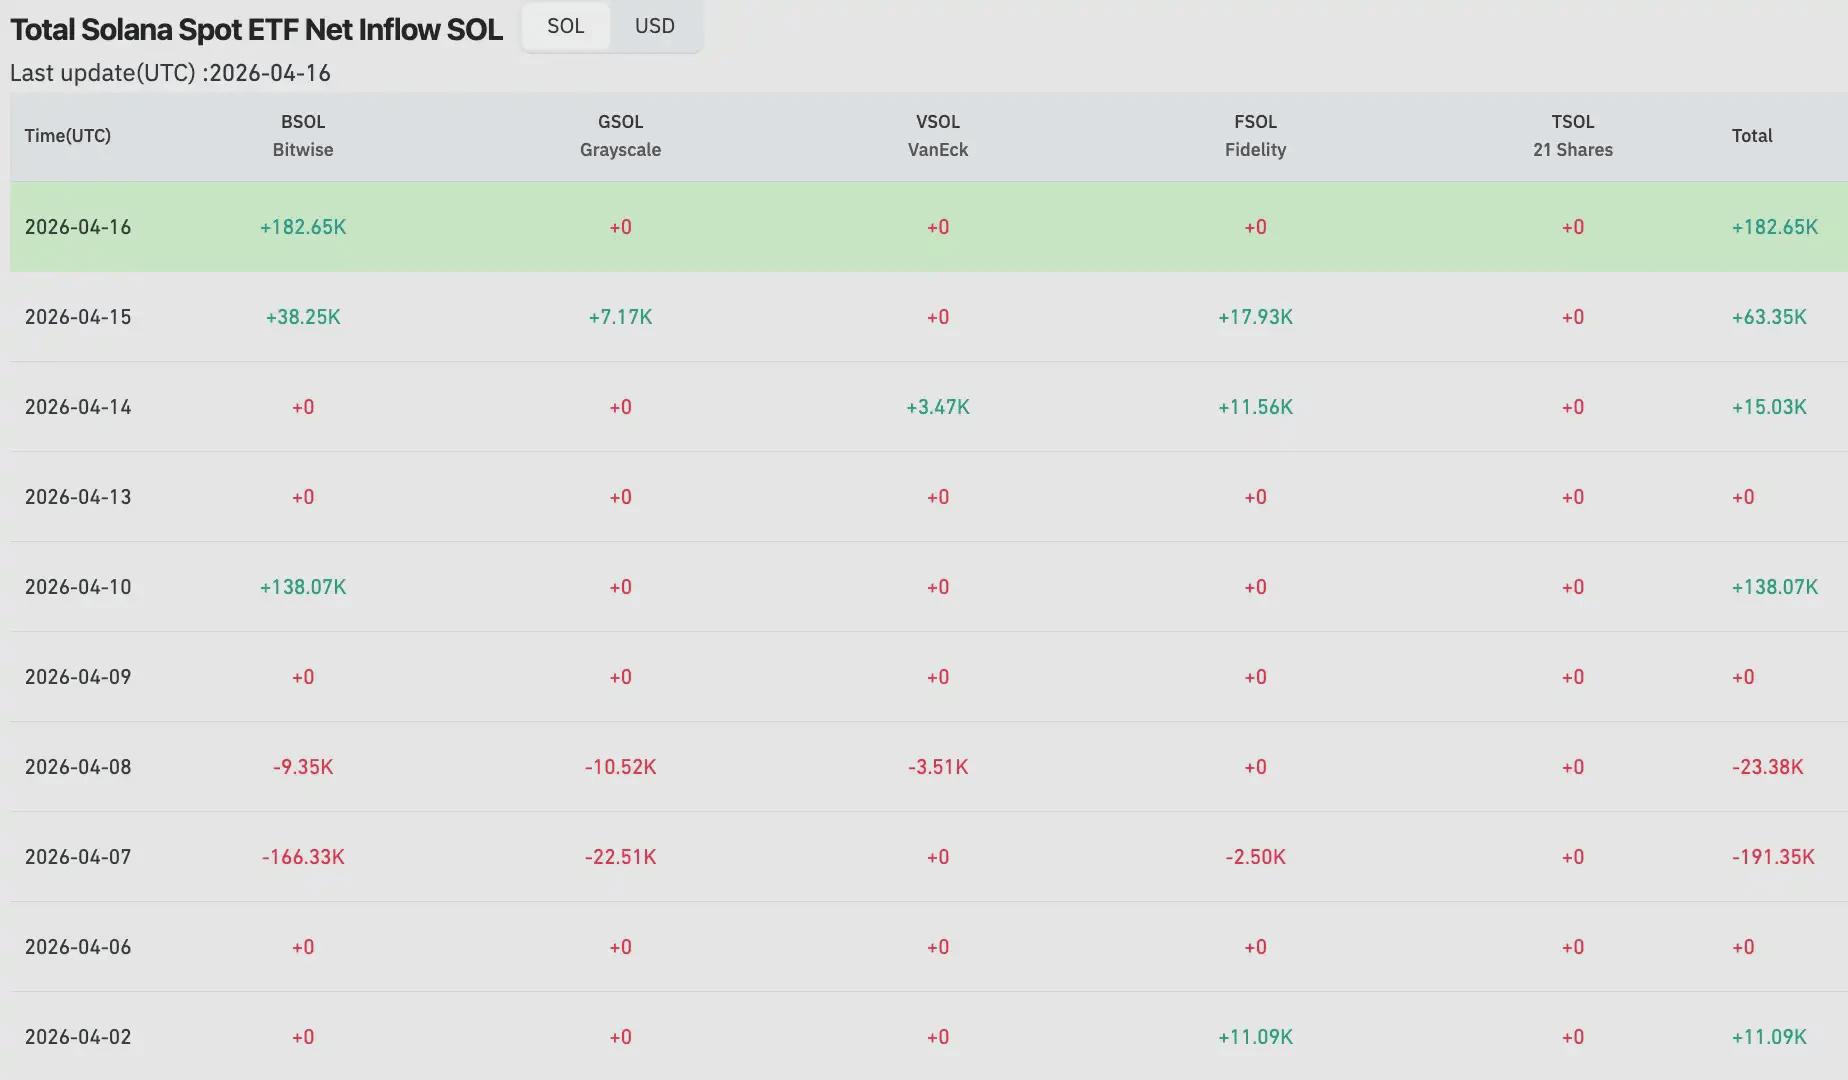
The movements of institutional funds provide evidence. At the beginning of April, the net inflow of the Solana ETF dropped to zero; previously, on March 30, it recorded a net outflow of $6.2 million. The XRP ETF continued to see net outflows at the beginning of the month, with only about $64,600 in minor inflow on April 2; although the Ethereum ETF saw a net inflow of $120 million on April 6, it had already seen a net outflow of $71 million the day before. The overall pattern of institutional funds in the direction of altcoins is one of observation, not rotation.
Comparing this to the real altcoin season in 2021, the gap is structural. That round saw BTC dominance drop from over 70% to below 40% from the beginning of the year to May, with a minimum touching around 39%. The rotation of funds between Bitcoin and altcoins was clearly visible, with the altcoin season index exceeding 90 at one point. That was a comprehensive expansion driven by macro liquidity flooding, with DeFi's summer heat not yet dissipated and retail FOMO entering on a large scale, with stablecoin issuance rapidly expanding during the same period, and incremental funds continuously flowing into the entire ecosystem. Today's 34 points and 58.5% represent a different scenery: the engine has just warmed up, and full-speed operation is still far away.
Here is a unique variable of this cycle. The institutional funds entering the market through ETFs follow the internal logic of asset allocation, not the emotional logic of the crypto market. Institutions are doing 'adjusting Bitcoin positions to X%', not 'the altcoin season is coming, let's increase altcoin holdings'. This batch of funds structurally will not spontaneously rotate into the altcoin market unless a clear directive is issued. This is the fundamental structural difference between 2021 and 2026; the money that came in 2021 included a lot of retail funds driven by 'wherever it's hot, let's go there', while today's institutional money is anchored, with fixed paths that do not drift with market sentiment.
The +97% on-chain trading volume is real, but a market without new money is a zero-sum game. Every winner's gain corresponds to another player's loss; the total amount in the entire pool hasn't increased. Stock games may not necessarily collapse, but they determine the structure of this game. The excitement belongs only to those who are already present and have chips. Newcomers usually use their own money to complete the last mile of unloading for others.
Epilogue.
Returning to the initial set of data, Bitcoin has risen about 0.85% over four days, while certain small-cap tokens have multiplied several times during the same period. Now you have a framework. The rise of Bitcoin is one thing; the macro environment is catching its breath, institutional funds are testing the water level, and the market is waiting for the next clear signal. The surge of altcoins is another thing; the structurally low market cap created by the oversold condition has allowed small amounts of capital to move prices in a thin liquidity container, and extreme negative funding rates have turned shorts into fuel for longs. The two events happening simultaneously do not mean they are telling the same story.
The altcoin season index is 34, and BTC dominance is 58.5%. According to historical standards from 2021, this machine hasn't even completed its warm-up program. BTC dominance needs to drop from 58% to about 39% as it was that year, institutional funds need to expand from 'Bitcoin allocation' to 'crypto asset portfolio allocation', and incremental funds need to continue flowing in instead of cashing out at the highs; none of these issues can be resolved by a single limit-up.
There are two types of people in this machine: one type knows who it operates for, and the other type is the fuel needed for its operation.
The rise of BTC is a signal, and the surge of altcoins is an echo. Distinguishing between these two matters is crucial to making a choice in this market that is not pre-designed by machines.