



Original author: Claude, Deep Tide TechFlow
Introduction: The S&P 500's CAPE ratio has reached 39, the highest level since the 2000 internet bubble; the 'Buffett Indicator' has surpassed 230%, setting a new historical high; the top ten constituent stocks account for over 35% of the index weight, reaching the highest concentration in modern markets. Multiple valuation indicators are simultaneously signaling overheating, but there is a serious divide in Wall Street's judgment: one side believes that AI profit growth supports the premium, while the other side thinks this is a classic characteristic of a bubble top.
The S&P 500 is in a rare state: almost all mainstream valuation indicators are flashing red at the same time.
CAPE (Shiller price-to-earnings ratio) approaches 40, the highest level since the internet bubble; the 'Buffett Indicator' (market cap/GDP ratio) has exceeded 230%, setting a new historical record; the top ten constituents account for over 35% of the index weight, and market concentration is at an unprecedented level in modern financial history. A post on Reddit community r/stocks characterizes the current market as 'the most overextended state in history,' garnering over 2100 likes and 640 comments, focusing on a core issue:
Is this a signal of a bull market top, or the beginning of a 'new paradigm' driven by AI?
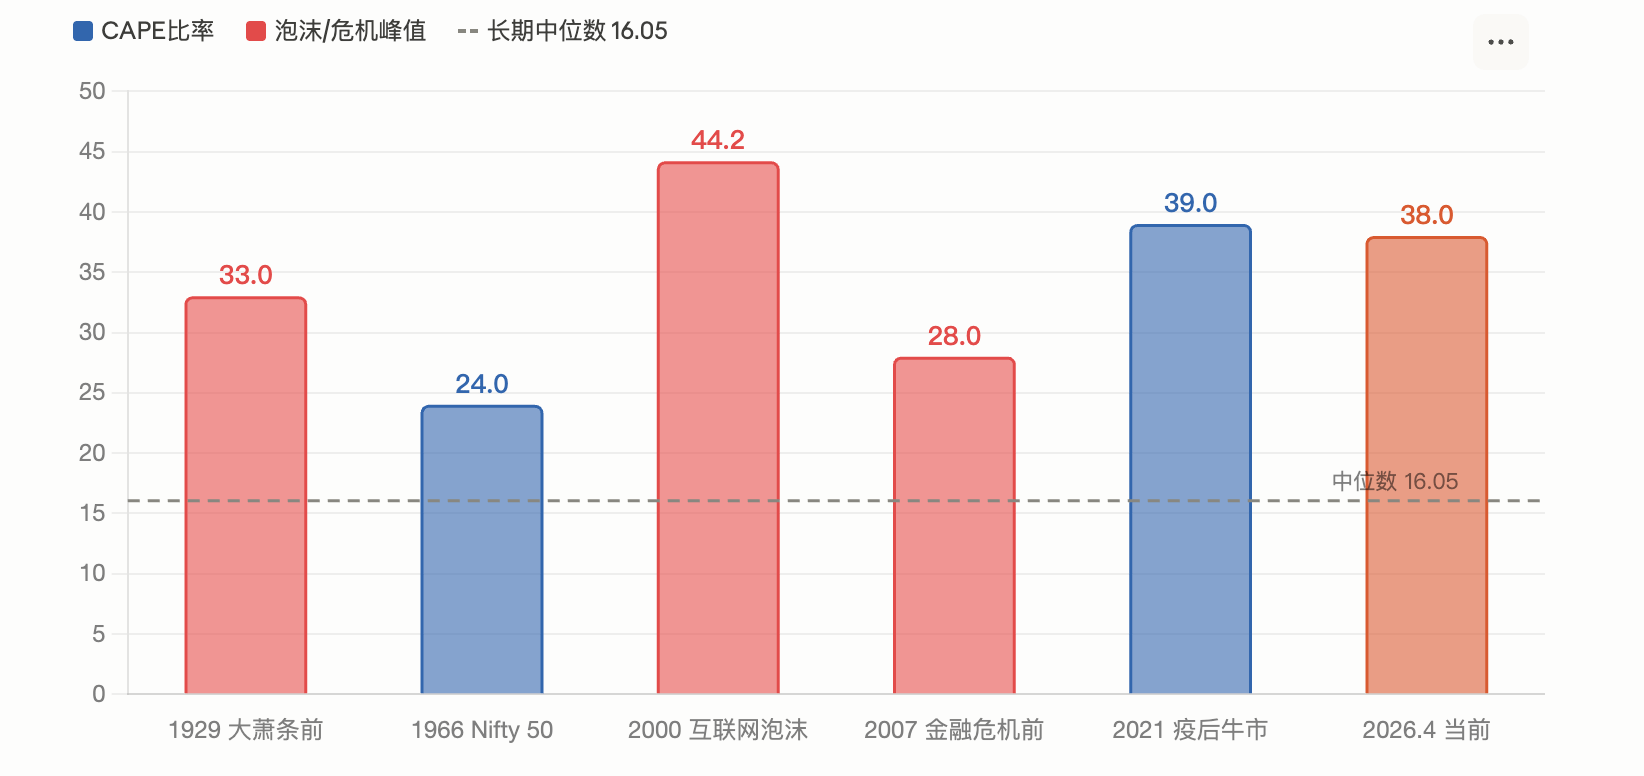
The CAPE ratio reached 39, second only to the peak of the 2000 internet bubble.
The Shiller price-to-earnings ratio (CAPE) is a valuation metric developed by Nobel laureate Robert Shiller, calculated using the average earnings adjusted for inflation over the past 10 years to derive the price-to-earnings ratio, aimed at eliminating the disturbances of short-term economic cycles.
According to Motley Fool's March report, the CAPE ratio of the S&P 500 reached 39.2 in February. According to GuruFocus data on April 1, this indicator is at 38.66. Both readings are at the second-highest historical level, only behind the 44.2 during the peak of the 2000 internet bubble, while the long-term median is only 16.05.
Historically, the CAPE has appeared at similar high levels twice: at the end of the 1920s (followed by the Great Depression) and in 2000 (after the internet bubble burst, the S&P 500 plummeted 49% within two and a half years). According to Shiller's research model, the current CAPE level corresponds to a future annualized return rate of only about 2%.
Motley Fool's analysis points out that Shiller himself has expressed concerns when the CAPE exceeds 25, noting that there have only been three periods since 1881 when it exceeded that level: around 1929, 1999, and 2007.
However, IndexBox's report also acknowledges that a high CAPE does not automatically mean a crash is imminent, as the market rose over 40% after the indicator broke through 30 at the end of 2023.
The 'Buffett Indicator' has surpassed 230%, setting the highest record in half a century.
Buffett once stated in a 2001 interview with (Fortune) magazine that the market cap/GDP ratio is 'the best single measure of valuation.' At that time, he suggested that 75%-90% is a reasonable range, and exceeding 120% indicates market overvaluation.
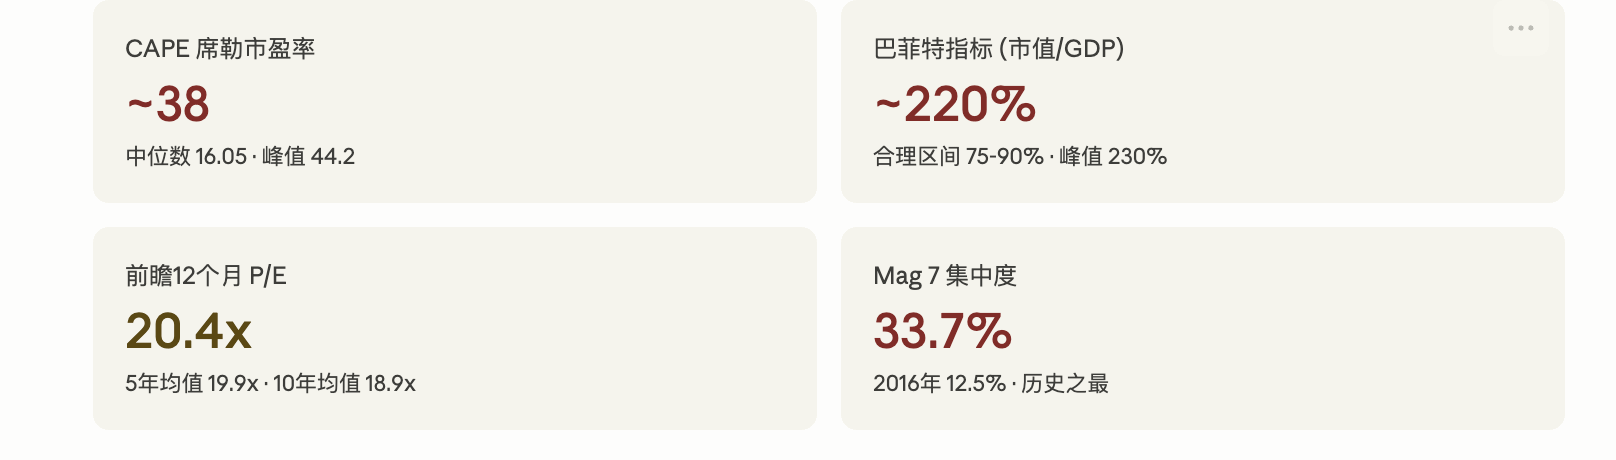
According to Advisor Perspectives data, as of early 2026, this indicator once reached 230.3%, the highest level on record, about 2.09 standard deviations above the trend line, defined as 'severely overvalued.' The latest reading in March fell back to 227.5%, still the second-highest historical level. GuruFocus estimates that based on this ratio, the annualized return rate of U.S. stocks over the next eight years will be about -0.3%.
According to GuruFocus data on April 14, this ratio is 219.5%. Critics point out that this indicator does not fully consider two structural changes: first, U.S. corporate profit margins have significantly increased compared to historical averages, and second, a growing proportion of large U.S. companies' income comes from overseas (boosting market capitalization but not reflected in domestic GDP). However, supporters argue that even after detrending, the current reading remains in a historically extreme range.
Market concentration is at an all-time high in modern history, with the Mag 7 accounting for over 30%.
Valuation is just one dimension of the problem. The structural risks in the market are equally unsettling.
According to AhaSignals data on April 13, the top ten constituents of the S&P 500 accounted for 35.59% of the index weight, the top five accounted for 25.97%, and the 'Magnificent 7' accounted for 30.44%. The comprehensive concentration risk index (ACRI) compiled by the agency has a reading of 81/100, at a 'critical' level. According to Motley Fool's April data, the weight of the Mag 7 in the S&P 500 has risen from 12.5% in 2016 to the current 33.7%.
A December 2025 report from CNBC cites a warning from Nick Ryder, Chief Investment Officer of Kathmere Capital: investors remain overly concentrated in the Mag 7, and he advises diversifying substantially outside of U.S. large-cap growth stocks. Yardeni Research President Ed Yardeni concurrently recommends that investors underweight the Mag 7 and overweight the 'Impressive 493.'
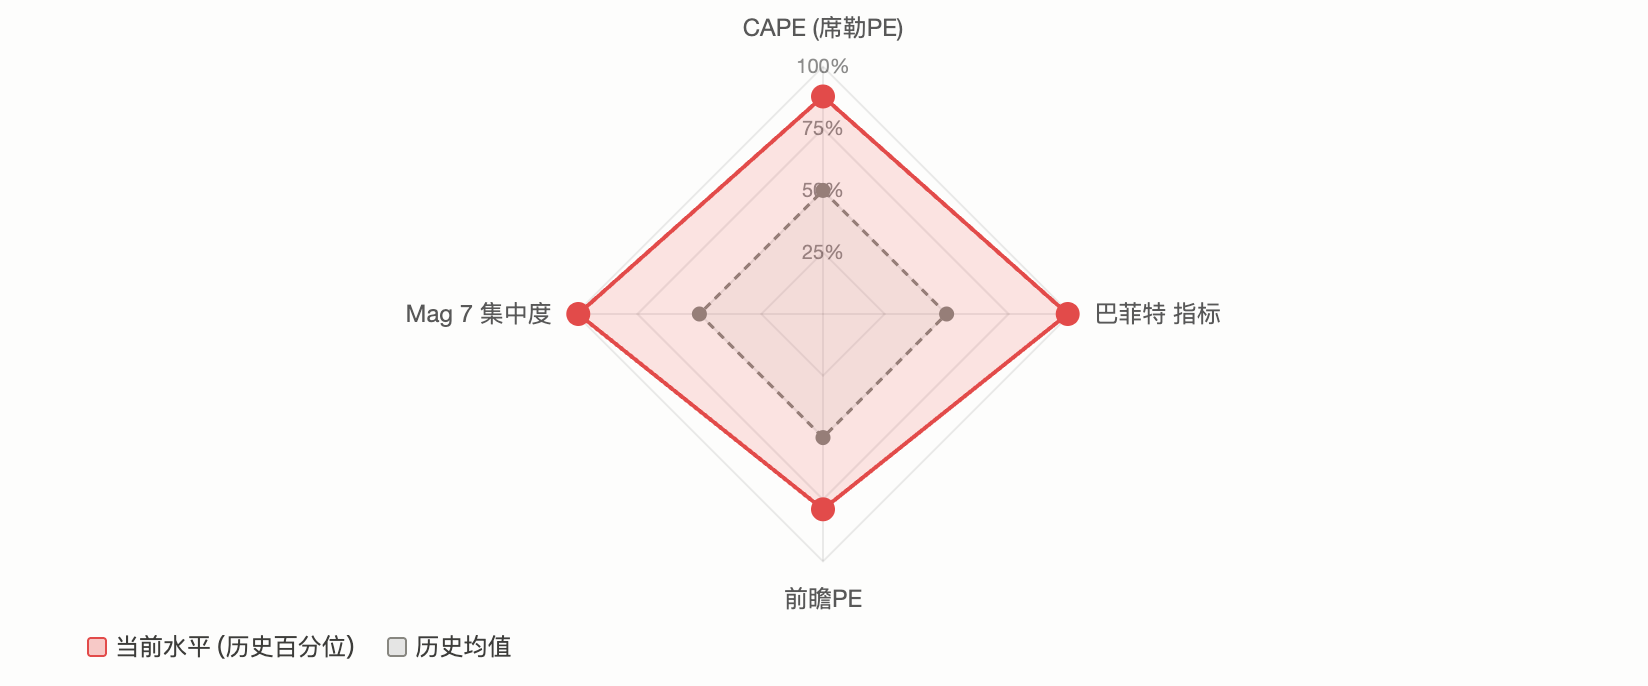
The actual risk brought by concentration is: when a few stocks dominate the index trend, their decline will disproportionately drag down the overall market. The first quarter of 2026 has preliminarily verified this point. According to 24/7 Wall St, Microsoft, Amazon, and Nvidia dropped approximately 20%, 9%, and 6% respectively this year, dragging the market-cap weighted S&P 500 down nearly 4%, while the equal-weighted S&P 500 (RSP) slightly turned positive during the same period.
The two camps are sharply divided: 'history repeats itself' or 'this time is different.'
Faced with this data, Wall Street's judgments have diverged sharply.
The core argument of the bears is the mean reversion of valuations. GMO co-founder Jeremy Grantham has explicitly characterized the current market as a large bubble driven by AI in his latest research. He points out that the actual income from current AI investments is far from the scale of capital expenditure, with OpenAI predicting an operating loss of $17 billion in 2026, which will expand to $35 billion in 2027. GMO believes that the classic signals of a bubble top (speculative stock crashes, high-quality stocks significantly outperforming) have not yet fully appeared, but this only means the bubble has not peaked, not that there is no bubble.
IO Fund's cycle analysis also leans toward caution. The agency's report points out that 2026 is at the intersection of the Gann 60-year cycle and the 4-year presidential cycle, while each stock in the Mag 7 has already peaked between July 2025 and February 2026, with core constituents having quietly retreated when the index made its last new high, which is a 'classic warning signal of the end of a bull market.'
The bulls emphasize the fundamentals of earnings. According to FactSet data from April, the forward 12-month price-to-earnings ratio of the S&P 500 is 20.4 times, although higher than the 10-year average of 18.9 times, it has fallen from 22 times at the end of 2025. Analysts predict a 17.6% growth in S&P 500 earnings for the full year of 2026; if this expectation is fulfilled, overvaluation can be digested to some extent.
Fidelity's Global Macro Research Director Jurrien Timmer's judgment is relatively moderate: since the conflict in Iran, the maximum drawdown of the S&P 500 has been less than 10%, a decline that historically occurs on average once a year. Earnings expectations still grow at an annualized rate of 17% and have yet to be significantly affected by geopolitical headlines.
Morgan Stanley's investment management team also pointed out in its 2026 outlook that most bull markets last 5 to 7 years, and historical data shows positive returns in the fourth year of a bull market. The bank's allocation for non-U.S. stocks has risen to historical highs.
BlackRock stated that the rise of technology stocks in 2025 will be driven mainly by earnings growth rather than valuation expansion, and that the current valuation based on growth expectations is reasonable.
Overlaying geopolitical shocks: the Iran war and stagflation risks.
Beyond the valuation debate, the macro environment adds additional uncertainty.
The conflict in Iran has pushed oil prices above $100 per barrel, and the S&P 500 briefly fell below the 200-day moving average in March. According to FinancialContent, the Federal Reserve maintained a 'hawkish stance' during its March meeting, with the updated dot plot only expecting one more rate cut for the remainder of 2026. In a report dated March 17, UBS characterized the recent volatility as a 'necessary reset of overvaluation' rather than the start of a bear market, maintaining a year-end target of 7700 points.
Goldman Sachs has raised the probability of recession over the next 12 months to about 30%. This resonates with the warnings from valuation indicators: if a recession coincides with overvaluation, the historical average peak-to-trough decline of the S&P 500 is 32%. However, if earnings continue to grow (FactSet consensus expectation is 17%), significant corrections are often limited in historical terms and recover relatively quickly.
For investors, the contradictions at the signal level are already very clear. Long-term valuation indicators are almost universally flashing red, but short- to medium-term earnings data remains strong. The market has reached a crossroads between 'valuation says no' and 'earnings say yes.' The outcome depends on whether AI capital expenditure can translate into sustained profits and whether geopolitical shocks ultimately lead to recession.