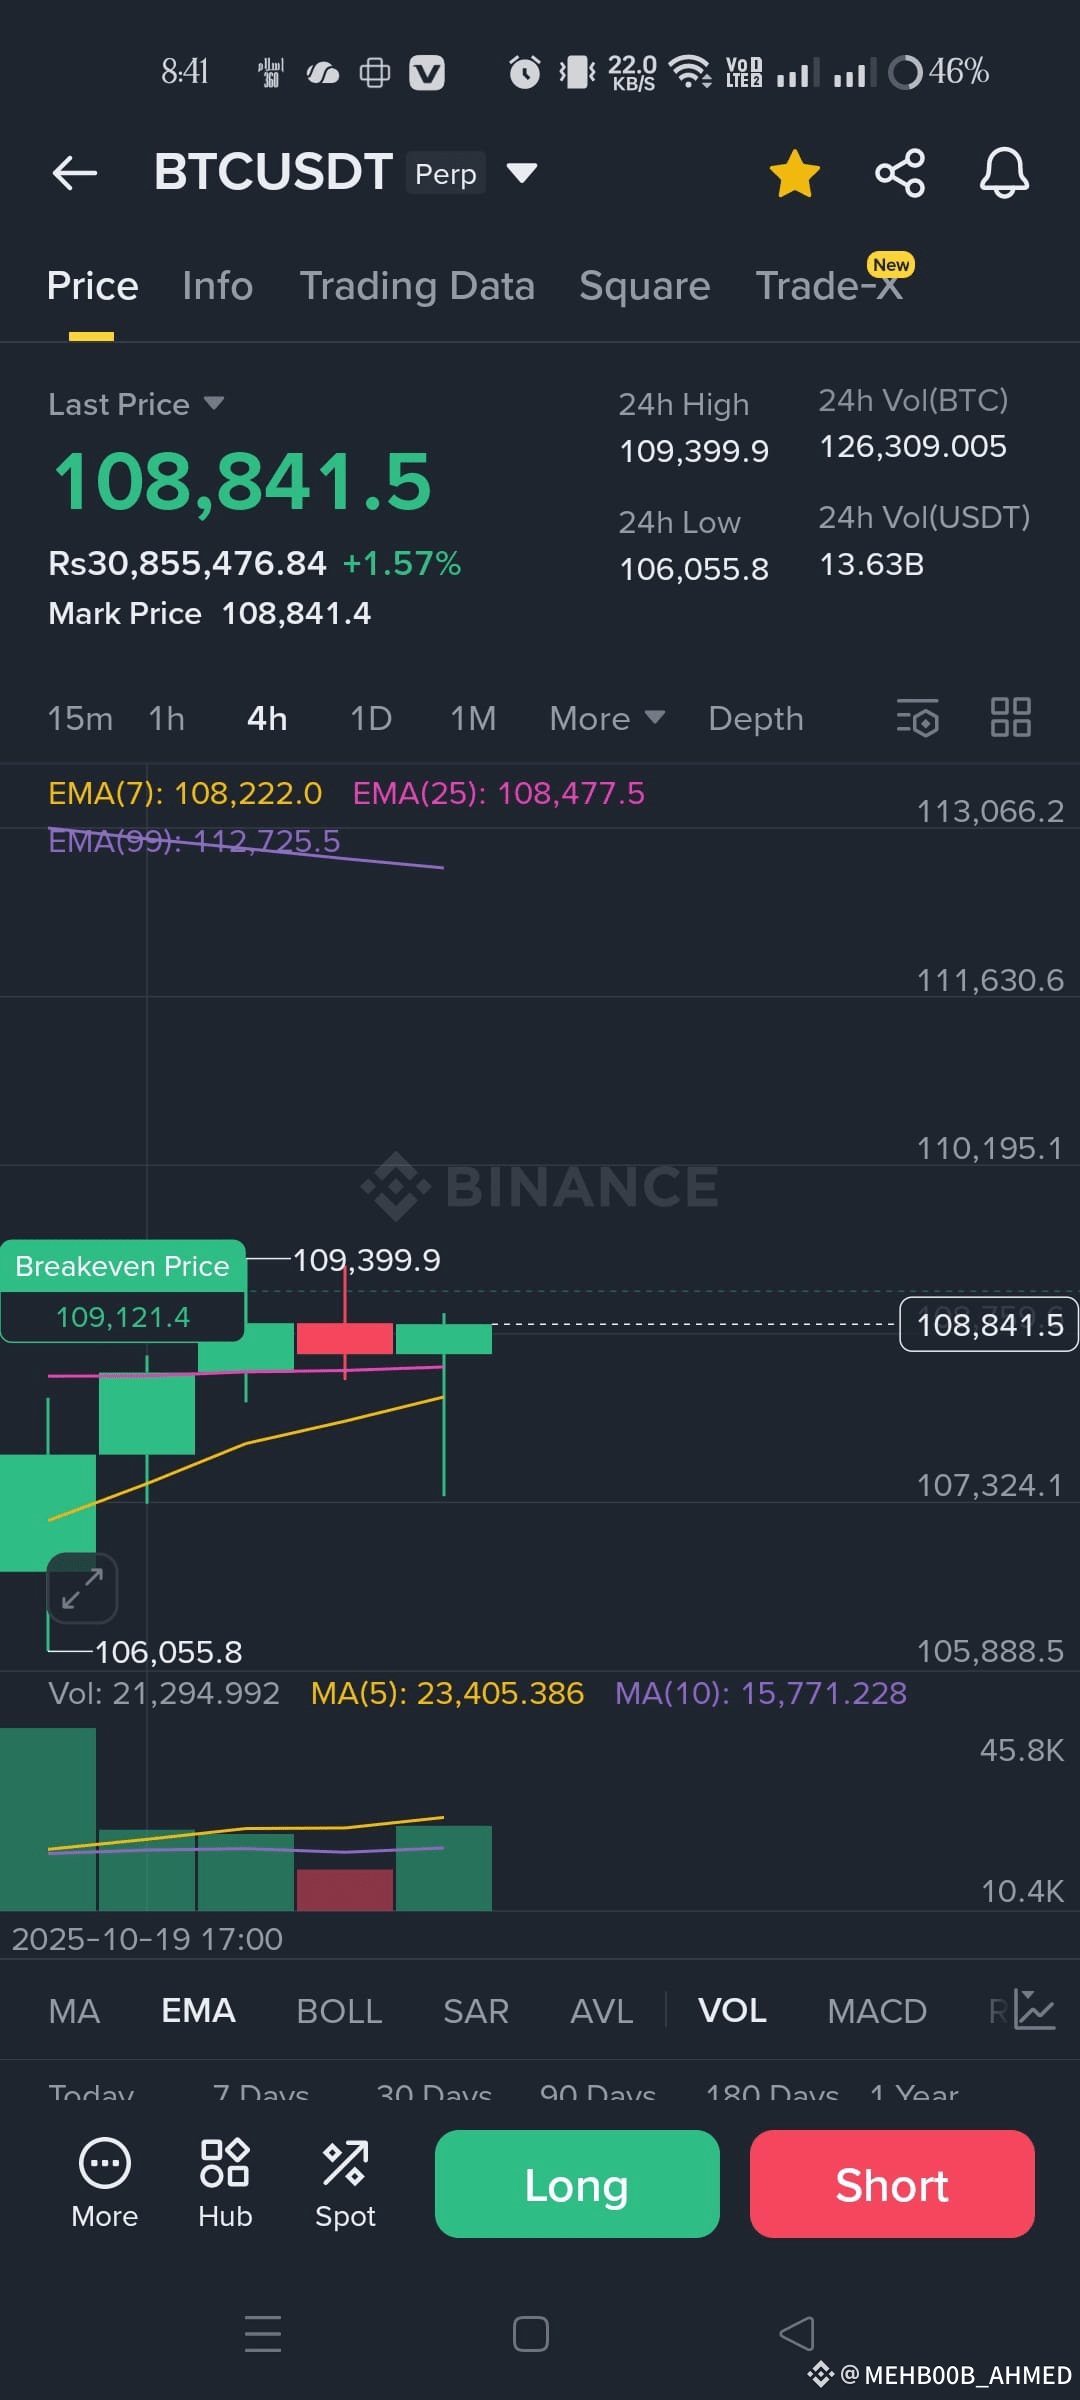
BTC Going 112400 ❤️🔥🔥🔥🔥Here is a quick summary of what this new screenshot shows, which is relevant for a trading decision:
Last Price: \text{108,841.5} USDT
Time Frame: You are currently looking at the 4-hour (4h) chart. This is a longer-term view compared to the previous 15m chart.
EMA (Exponential Moving Averages):
EMA(7): \text{108,222.0}
EMA(25): \text{108,477.5}
EMA(99): \text{112,725.5}
EMA Crossover/Trend:
The price (\text{108,841.5}) is above both the EMA(7) (\text{108,222.0}) and EMA(25) (\text{108,477.5}). This is a bullish sign in the short-to-medium term (on this 4h chart).
However, all three short-term indicators (Price, EMA(7), EMA(25)) are below the longer-term EMA(99) (\text{112,725.5}). This suggests that the current price is in a downtrend when looking at the larger, EMA(99) period.
Key Price Range: The price has recently broken above the Breakeven Price shown on the chart, which is \text{109,399.9}. Correction: The price is currently \text{108,841.5}, which is actually just below the marked Breakeven Price \text{109,399.9}.
What to Consider Now
Since you are looking at the 4-hour chart, your decision should be based on a longer-term view:
Long (Buy): A trader might consider a Long position because the short-term trend (EMA 7 & 25) is currently pointing up. You would be betting on the price continuing to move toward and above the EMA(99).
Short (Sell): A trader might consider a Short position because the price is still significantly below the long-term EMA(99), which often acts as a strong resistance level. You would be betting that the long-term downtrend will continue.
Last Price: \text{108,841.5} USDT
Time Frame: You are currently looking at the 4-hour (4h) chart. This is a longer-term view compared to the previous 15m chart.
EMA (Exponential Moving Averages):
EMA(7): \text{108,222.0}
EMA(25): \text{108,477.5}
EMA(99): \text{112,725.5}
EMA Crossover/Trend:
The price (\text{108,841.5}) is above both the EMA(7) (\text{108,222.0}) and EMA(25) (\text{108,477.5}). This is a bullish sign in the short-to-medium term (on this 4h chart).
However, all three short-term indicators (Price, EMA(7), EMA(25)) are below the longer-term EMA(99) (\text{112,725.5}). This suggests that the current price is in a downtrend when looking at the larger, EMA(99) period.
Key Price Range: The price has recently broken above the Breakeven Price shown on the chart, which is \text{109,399.9}. Correction: The price is currently \text{108,841.5}, which is actually just below the marked Breakeven Price \text{109,399.9}.
What to Consider Now
Since you are looking at the 4-hour chart, your decision should be based on a longer-term view:
Long (Buy): A trader might consider a Long position because the short-term trend (EMA 7 & 25) is currently pointing up. You would be betting on the price continuing to move toward and above the EMA(99).
Short (Sell): A trader might consider a Short position because the price is still significantly below the long-term EMA(99), which often acts as a strong resistance level. You would be betting that the long-term downtrend will continue.