

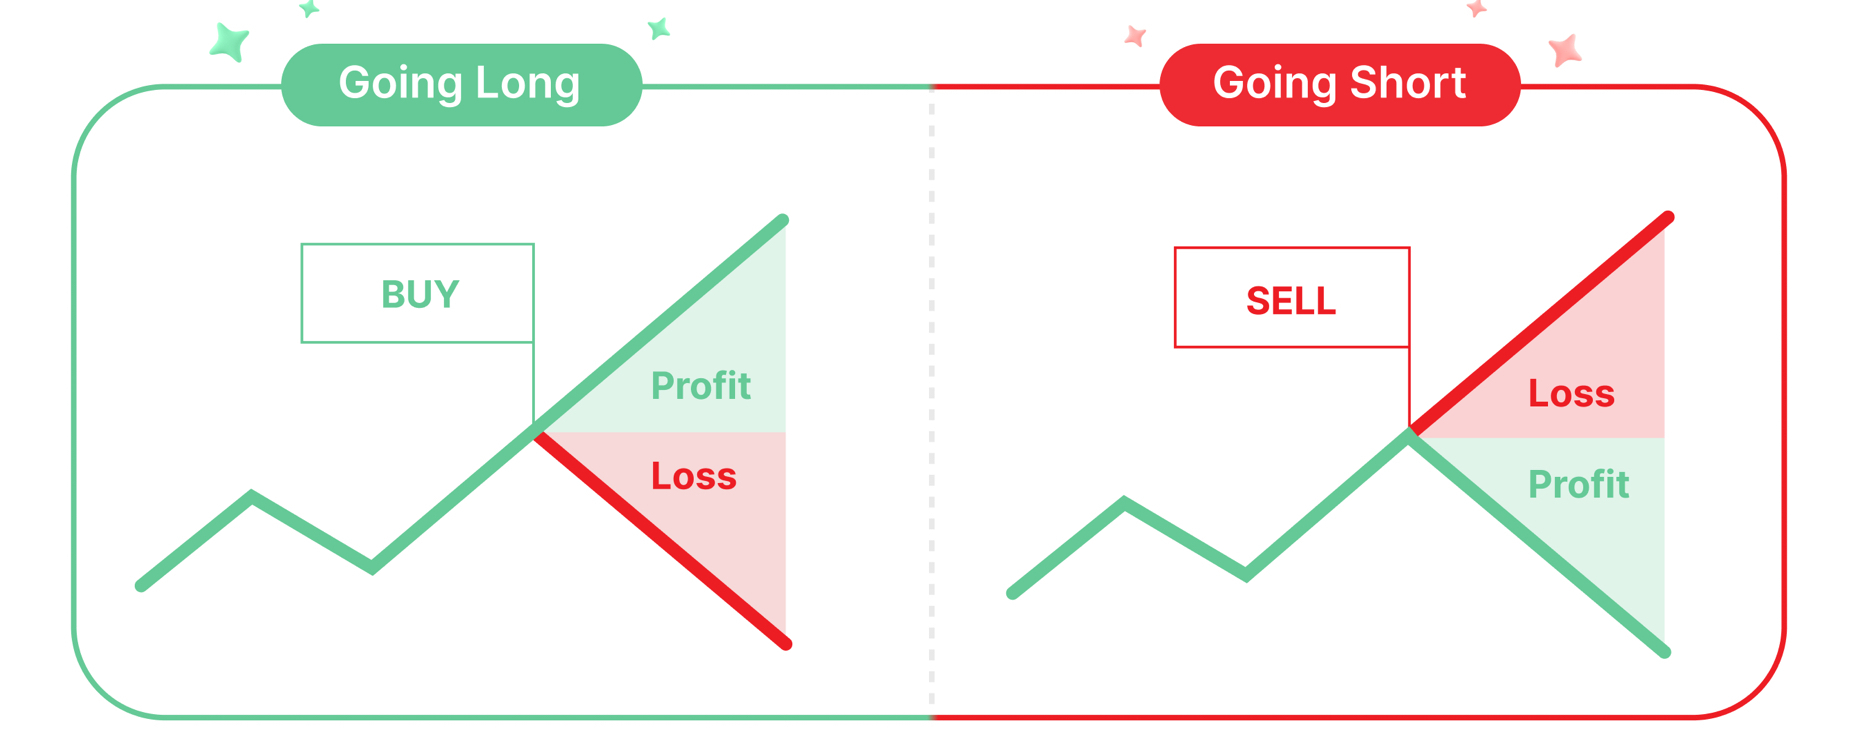

In the world of crypto trading and futures, the analysis of volumes and positions is critically important for understanding who currently controls the market — buyers or sellers. Although the concepts of Net Long/Short Positions and CVD (Cumulative Volume Delta) are often mentioned together, they reflect different aspects of market activity.

1. What are Net Long/Short Positions?
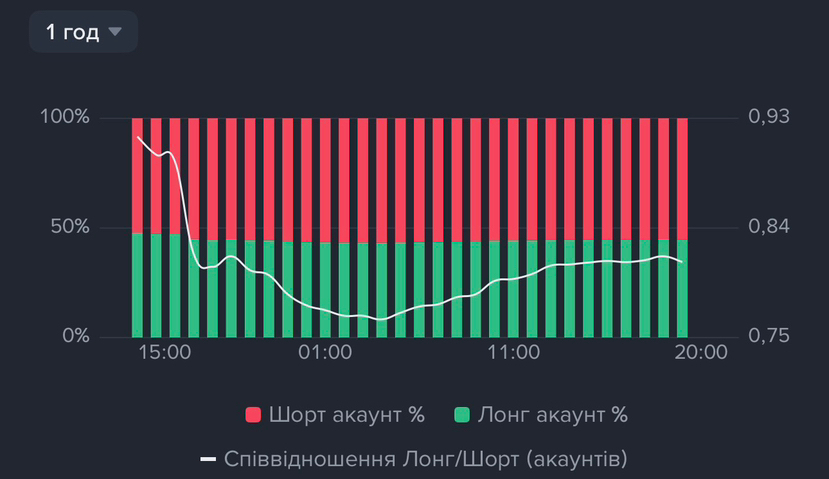
Net Long/Short Positions is the net difference between the number of open long and short positions in the futures market.
When we talk about this indicator, we usually mean the sentiment of large players or the market as a whole. Since there is always an open short position for every open long position (counterparty), the "net" position in absolute numbers of the futures contract is always equal to zero.
However, traders use this term to denote:
• Long/Short Ratio: The ratio of the number of accounts in longs to those in shorts.
• Top Traders Sentiment: Positions of "whales" or professional traders (for example, data from the Binance exchange).
‼️Key logic: If the indicator shifts towards Long, it indicates bullish sentiment. However, extremely high long values often signal an impending "squeeze" (mass liquidation of buyers), as the market finds it hard to grow under the weight of excessive leverage.‼️
2. Cumulative Volume Delta (CVD) — The engine of price
CVD is the cumulative difference between the volume of purchases and sales for market orders. It is one of the most powerful tools of volume technical analysis (Order Flow).
How Delta is calculated:

How CVD works:
CVD is the sum of all delta values over a certain period. It shows the aggression of market participants.
• Market orders are the "aggressors" that push the price.
• Limit orders are "passive" players who provide liquidity (walls).
3. Practical application and Divergences
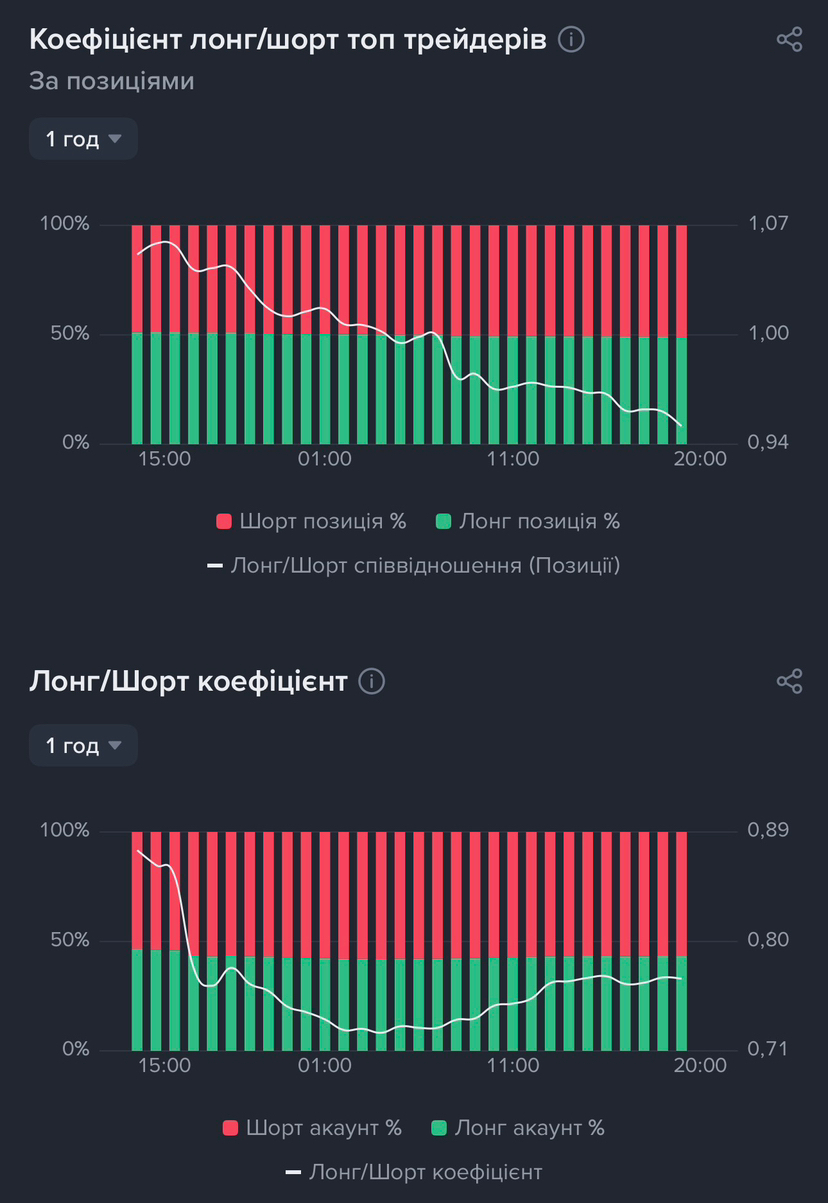
The most valuable information appears when the price movement does not align with the movement of CVD. This is called divergence.
1. Bullish divergence (Buy)
• Chart: Price is falling or stagnant.
• CVD: Sharp decline (aggressive selling).
• Essence: Sellers are fiercely pushing "at market," but a large player has set a limit support and is buying everything up. Sellers just break against it.
2. Bearish divergence (Sell)
• Chart: Price is rising or stagnant.
• CVD: Sharp rise (aggressive buying).
• Essence: The crowd buys "at market" out of FOMO, but a large player has set a limit resistance and is closing their positions against these buyers. The price cannot break this "ceiling."
4. Combination of Net Positions and CVD
For professional analysis, it is worth looking at these indicators comprehensively:
1. Open Interest (Open interest) + CVD: If the price rises, OI rises and CVD rises — this is a strong "healthy" trend.
2. CVD + Liquidations: If CVD falls sharply while the price rises — this often signals a "short squeeze" (forced closure of shorts, which technically is a buying).
3. Net Long/Short Ratio: Helps to understand who is more prevalent in the market — the "crowd" or big money. If retail traders are heavily in longs, and CVD starts to weaken — this is a signal for caution.
Conclusion
Net Long/Short is a sentiment map and potential liquidation zones.
CVD is an indicator of real aggression "here and now."
Use CVD to find reversal points through absorption, and Long/Short positions to understand the global context and identify traps for "retail traders."
📊Volume Profile (VPVR): An X-ray of the market and hidden liquidity