
First: Fundamental analysis (news and developments)
Partnerships: Audiera recently announced (April 8) a strategic partnership with the Lovebit project, which is a project based on the BSC network focusing on environmental and social governance (ESG). This enhances the project's narrative in the fields of artificial intelligence and social impact.
Unlock: Approximately 21.25 million tokens were unlocked at the beginning of April, which explains the selling pressure seen on the chart recently, as the market tries to absorb this new liquidity.
Expansions: The project launched a "Trading Competition" with prizes up to $200,000 to boost demand and liquidity, with a periodic token burn mechanism to reduce supply.
Second: Technical analysis (Chart Analysis)
By reading the three charts (1-day, 4-hour, 1-hour):
General trend:
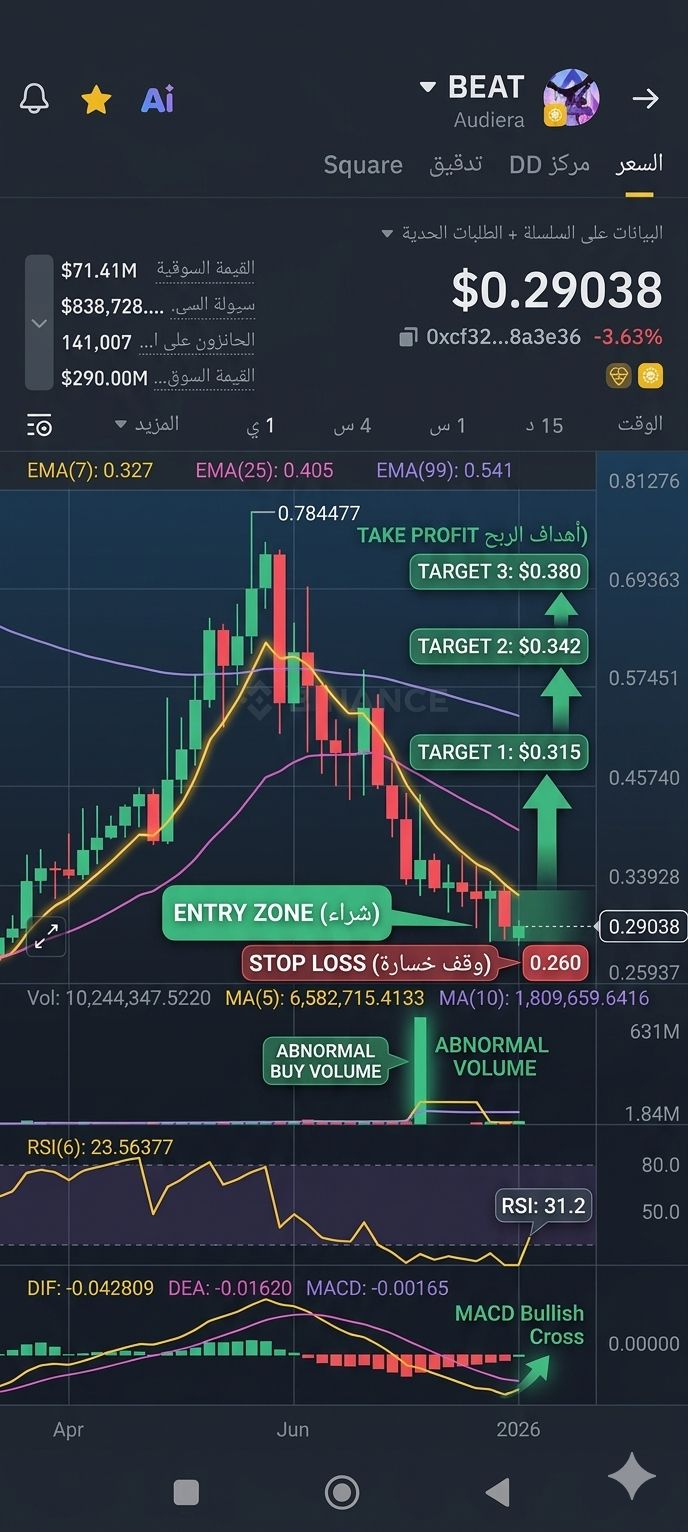
On the daily chart: the trend is clearly down after the coin reached a peak of $0.78, and the price is currently trading below the moving averages (EMA 7, 25, 99).
On the hourly chart: we started to notice an attempt to form a "bottom" at levels of $0.2650 with the appearance of green buying candles and a slight rebound.
Technical indicators:
RSI (Relative Strength Index): on the daily chart, it is nearing the oversold area (reached 23), while on the hourly chart, it started to rebound upwards (61), indicating a momentary buying strength trying to reverse the trend.
MACD: The selling momentum is starting to weaken on smaller time frames, with a positive crossover imminent for the lines above the zero level on the hourly chart.
Volume: We notice a "huge" green volume candle in the third chart, indicating the entry of "whales" or institutional liquidity at current support areas.
Support and resistance:
Main support: $0.2650 (current rebound area).
Nearby resistance: $0.3100.
Strong resistance: $0.3450.
Third: Entry signal
Based on the fact that the coin is in the "oversold" area on larger time frames and signs of a rebound are starting to appear with strong volume on smaller time frames:
Entry signal: Buy
Entry price: between $0.2850 and $0.2920 (the current price is very suitable).
Stop Loss: Close 4-hour candle below $0.2600 (because breaking this level means continued bleeding).
Take Profit targets:
First target: $0.3150 (achieving quick profit).
Second target: $0.3420 (EMA 99 resistance level on the hourly chart).
Third target (medium range): $0.3800.
Additional advice: Do not invest all your capital in one trade; due to current market volatility and the recent unlocking pressure, it is advisable to enter with 20-30% of the allocated trading portfolio.