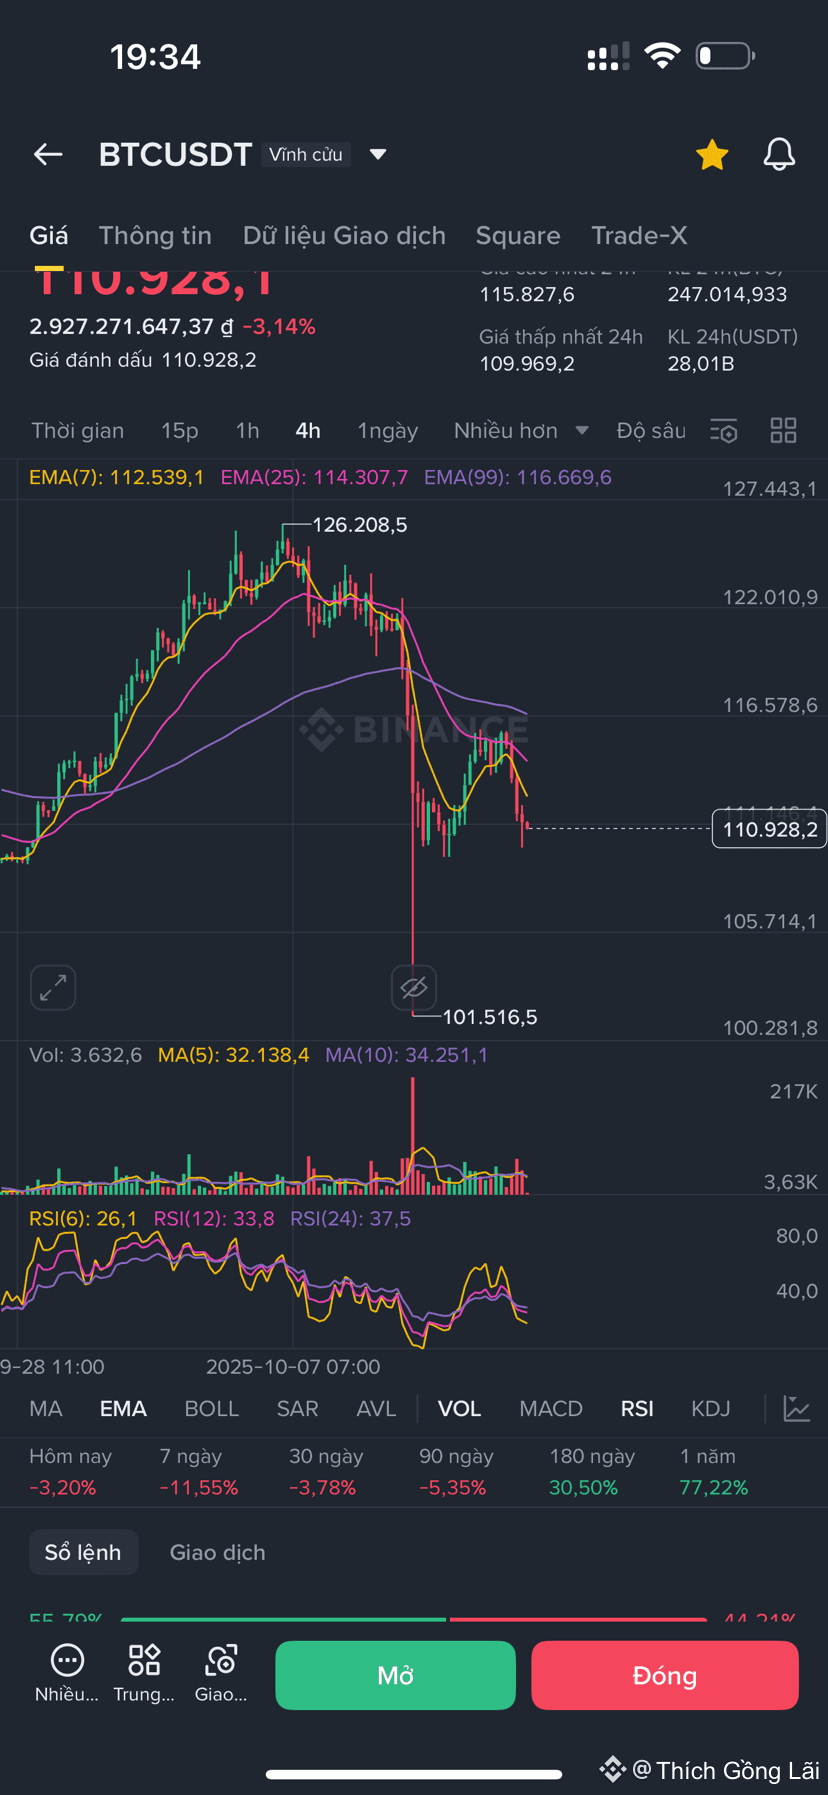
🧭 1. Overview of trends
• Current price: 110.928 USDT
• 24h volatility: -3.14%
• 24h high: 115.827 USDT
• 24h low: 109.969 USDT
→ BTC is in a medium-term downtrend, losing support level 114,000 – 115,000 USD, and is currently testing the important support area around 110,000 USD.
⸻
📉 2. EMA lines
• EMA(7): 112.539
• EMA(25): 114.307
• EMA(99): 116.669
👉 Order of arrangement: EMA7 < EMA25 < EMA99 → confirms the medium-term downtrend.
The price is currently below all 3 EMAs, indicating that selling pressure remains dominant and there are no clear signs of a reversal.
⸻
📊 3. RSI indicator
• RSI(6): 26.1
• RSI(12): 33.8
• RSI(24): 37.5
👉 RSI is in the 30–35 range, which is slightly oversold, and a short-term technical bounce may occur,
but not strong enough to reverse — the market is still in the “bear control” zone.
⸻
🔍 4. Trading volume
• Volume has gradually decreased after a strong drop (high red column at 101.516).
→ Indicates that after a major sell-off, the market is temporarily calming down, but there are no clear bottom-fishing funds yet.
⸻
⚙️ 5. Price structure
• Most recent high: 126.208 → 122.000 → 116.000 → currently 111.000
→ The series of peaks is lower than the previous peaks, clearly indicating a downtrend (Lower Highs, Lower Lows).
• Strong support: 109.500 – 110.000
• Next support: 101.500 – 102.000 (previous low)
• Nearest resistance: 112.500 – 114.000 (EMA7/EMA25)
⸻
📈 6. Upcoming scenarios
🟥 Bearish scenario (dominant)
• If BTC breaks below the 109.500 area, the price may drop further to 101.500 – 102.000 USDT.
• Both EMA and RSI support this scenario if there is no strong buying force.
🟨 Technical rebound scenario
• If BTC holds the 110.000 – 110.500 area and RSI rises > 40, a rebound may occur.
• Current price: 110.928 USDT
• 24h volatility: -3.14%
• 24h high: 115.827 USDT
• 24h low: 109.969 USDT
→ BTC is in a medium-term downtrend, losing support level 114,000 – 115,000 USD, and is currently testing the important support area around 110,000 USD.
⸻
📉 2. EMA lines
• EMA(7): 112.539
• EMA(25): 114.307
• EMA(99): 116.669
👉 Order of arrangement: EMA7 < EMA25 < EMA99 → confirms the medium-term downtrend.
The price is currently below all 3 EMAs, indicating that selling pressure remains dominant and there are no clear signs of a reversal.
⸻
📊 3. RSI indicator
• RSI(6): 26.1
• RSI(12): 33.8
• RSI(24): 37.5
👉 RSI is in the 30–35 range, which is slightly oversold, and a short-term technical bounce may occur,
but not strong enough to reverse — the market is still in the “bear control” zone.
⸻
🔍 4. Trading volume
• Volume has gradually decreased after a strong drop (high red column at 101.516).
→ Indicates that after a major sell-off, the market is temporarily calming down, but there are no clear bottom-fishing funds yet.
⸻
⚙️ 5. Price structure
• Most recent high: 126.208 → 122.000 → 116.000 → currently 111.000
→ The series of peaks is lower than the previous peaks, clearly indicating a downtrend (Lower Highs, Lower Lows).
• Strong support: 109.500 – 110.000
• Next support: 101.500 – 102.000 (previous low)
• Nearest resistance: 112.500 – 114.000 (EMA7/EMA25)
⸻
📈 6. Upcoming scenarios
🟥 Bearish scenario (dominant)
• If BTC breaks below the 109.500 area, the price may drop further to 101.500 – 102.000 USDT.
• Both EMA and RSI support this scenario if there is no strong buying force.
🟨 Technical rebound scenario
• If BTC holds the 110.000 – 110.500 area and RSI rises > 40, a rebound may occur.