ESP/USDT: Local pullback or bottom hunting? 📉
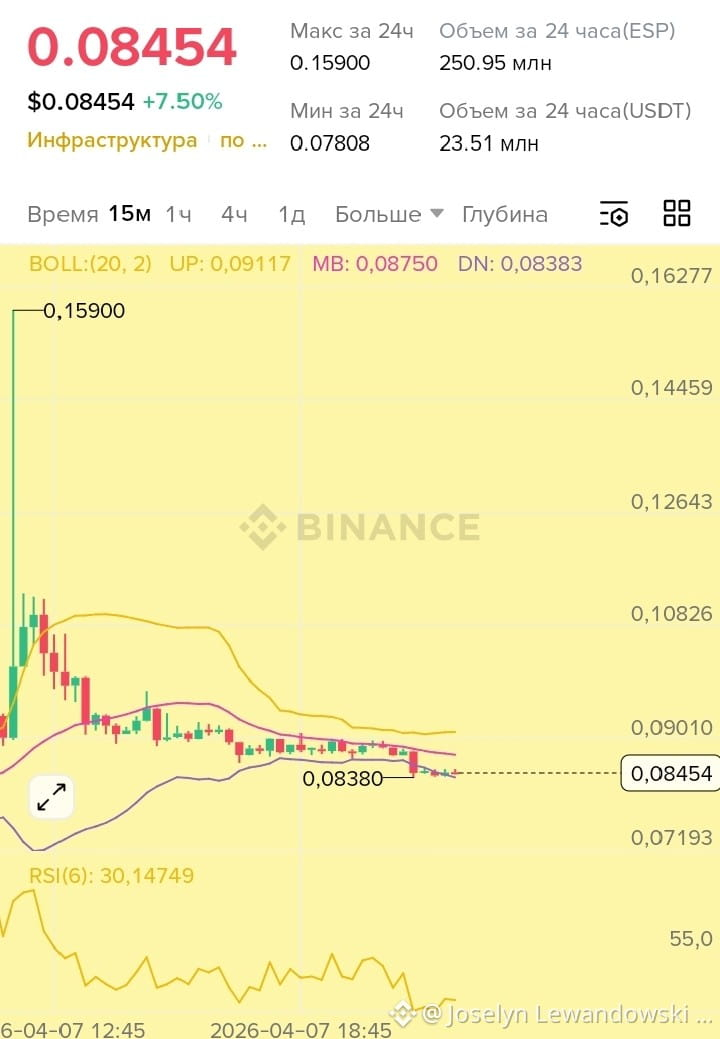
On the ESP/USDT chart, we currently observe an interesting picture. After serious volatility, the price has come to the mark of 0.08454.
What stands out in the indicators:
Bollinger Bands (20, 2): The price has closely approached the lower boundary (DN: 0.08383). Usually, this is the zone where the asset is oversold, and a local rebound is possible.
RSI (6): The value is around 30.14. This is a classic oversold zone. On the 15-minute timeframe, this may signal the fading of the downward momentum.
Context: We see a strong wick above (high at 0.15900), after which the market cools down. There is currently consolidation at an important support level.
I will watch the buyer's reaction at current levels. If we hold 0.08380, there are chances for a technical return to the middle Bollinger line (MB: 0.08750).
Remember, this is not financial advice. Always conduct your own analysis and manage your risks! 🛡️
#Crypto #BinanceSquare #ESP #TechnicalAnalysis
On the ESP/USDT chart, we currently observe an interesting picture. After serious volatility, the price has come to the mark of 0.08454.
What stands out in the indicators:
Bollinger Bands (20, 2): The price has closely approached the lower boundary (DN: 0.08383). Usually, this is the zone where the asset is oversold, and a local rebound is possible.
RSI (6): The value is around 30.14. This is a classic oversold zone. On the 15-minute timeframe, this may signal the fading of the downward momentum.
Context: We see a strong wick above (high at 0.15900), after which the market cools down. There is currently consolidation at an important support level.
I will watch the buyer's reaction at current levels. If we hold 0.08380, there are chances for a technical return to the middle Bollinger line (MB: 0.08750).
Remember, this is not financial advice. Always conduct your own analysis and manage your risks! 🛡️
#Crypto #BinanceSquare #ESP #TechnicalAnalysis