📊 Market Structure
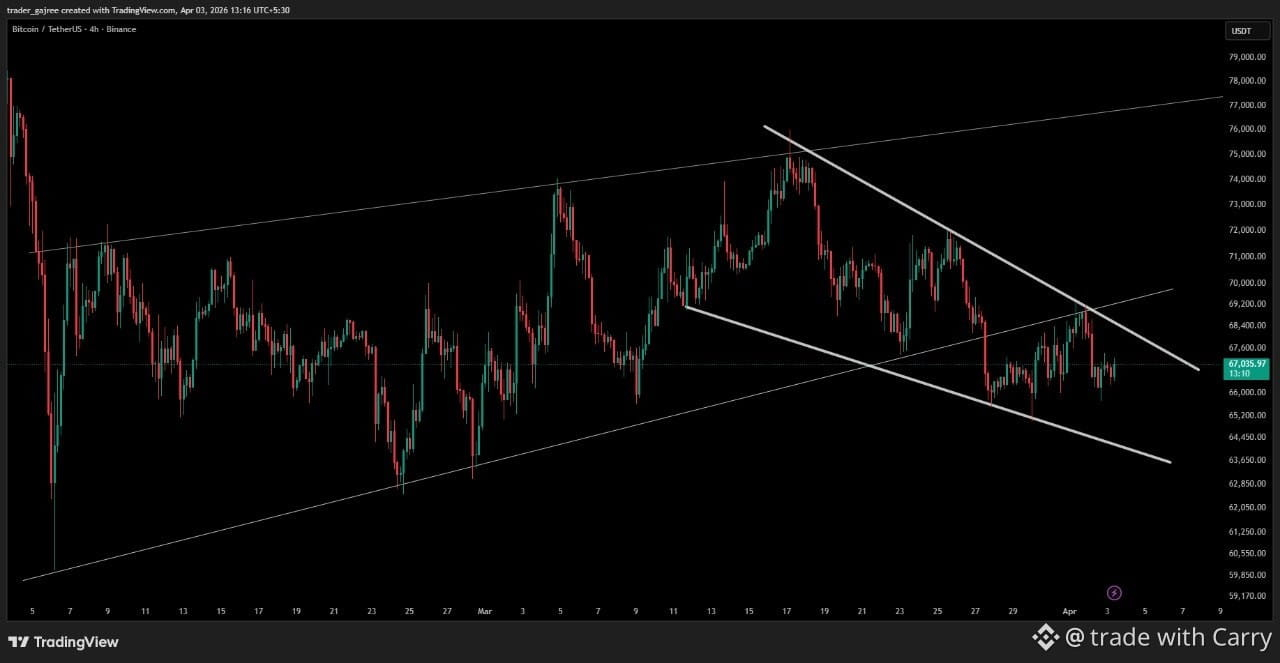
From your 4H BTC chart, price is moving inside a descending channel while also interacting with a larger rising trendline from previous months.
Key observations:
Lower highs forming → short-term bearish pressure
Price respecting descending resistance
Market sitting near mid-channel consolidation
Larger structure still range / compression
📉 Resistance Zone
67,800 – 69,200
This area aligns with:
Descending trendline resistance
Previous lower highs
Supply reaction zone
If price rejects here, downside continuation becomes likely.
📈 Support Zones
First Support: 65,800 – 66,000
Major Support: 63,800 – 64,200 (channel bottom)
These zones are where buyers previously stepped in.
🔑 Possible Scenarios
1️⃣ Bearish Scenario (Higher Probability currently)
If price rejects from descending trendline:
Targets:
65,800
64,200
63,500
2️⃣ Bullish Scenario (Only after breakout)
If BTC breaks and closes above 69,200:
Targets:
71,000
73,000
75,000
⚠️ Key Insight
The market is currently in a compression between two trendlines.
Usually this type of structure leads to a strong breakout move soon.
👉 Until breakout, expect fake moves and liquidity sweeps.
💡 Simple trader view:
Below 69K → bearish pressure
Above 69K → bullish breakout
$BTC