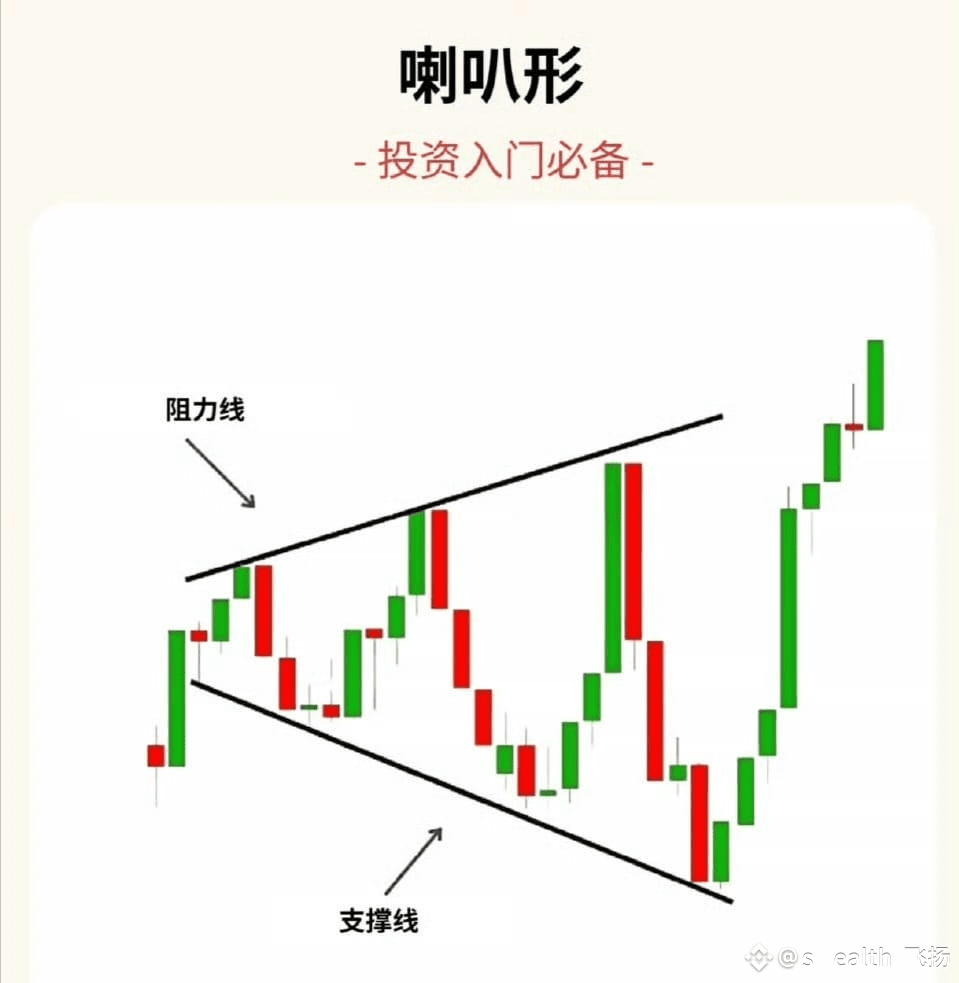
How to Identify the Horn Pattern and Capture Key Trading Signals
In the complex and ever-changing price movements of the financial market, there is a pattern that stands out, known as the horn pattern, also referred to as the expansion pattern or diffusion pattern. Once this pattern appears, it often indicates that significant changes are about to occur in the market.
What is the Horn Pattern
The horn pattern is a typical reversal pattern that often appears during phases of extreme market sentiment, whether euphoric or panic-driven, and when volatility reaches a fever pitch. Its formation stems from a continuous widening of price fluctuations, visually resembling a gradually opened horn, hence the name.
Distinct Features of the Horn Pattern
1. Gradually Expanding Price Fluctuations: The price trend shows a pattern of continuously refreshed highs and persistently depressed lows, outlining a unique shape where the upper and lower boundaries expand. A complete horn pattern requires at least two higher highs and two lower lows to form.
2. Volume Characteristics: As price fluctuations become more intense, trading volume will also increase correspondingly, especially when the price breaks through key levels; the changes in volume are quite significant, reflecting the intense struggle between bulls and bears in the market.
3. Three Types
• Ascending Horn Pattern (Bearish): When it appears at the end of an upward trend, it serves as a warning bell to the market, indicating that the upward trend is about to end and a downward trend may follow.
• Descending Horn Pattern (Bullish): If it is seen at the tail end of a downward trend, it is like a ray of light in the darkness, suggesting that the market is about to hit the bottom and rebound, starting an upward journey.
• Symmetrical Horn Pattern (Neutral): This pattern does not have a clear direction, with uncertainty regarding the breakout direction, which could be either upward or downward. At this point, it is necessary to combine it with other technical indicators for a comprehensive judgment to accurately grasp the market trend.
Key Points to Note During Trading
1. Frequent False Breakouts: Due to the market being in a state of intense volatility, false breakout situations frequently occur within the horn pattern. This requires investors to be cautious during trading, avoiding easy misguidance by false signals, and making decisions only after multiple confirmations.
2. Combine with Other Indicators: To improve the accuracy of trading decisions, it is recommended to analyze the horn pattern in conjunction with commonly used technical indicators such as RSI, MACD, and trend lines. By examining the market from multiple dimensions, one can gain a more comprehensive understanding of market dynamics and reduce the risk of misjudgment.
In the complex and ever-changing price movements of the financial market, there is a pattern that stands out, known as the horn pattern, also referred to as the expansion pattern or diffusion pattern. Once this pattern appears, it often indicates that significant changes are about to occur in the market.
What is the Horn Pattern
The horn pattern is a typical reversal pattern that often appears during phases of extreme market sentiment, whether euphoric or panic-driven, and when volatility reaches a fever pitch. Its formation stems from a continuous widening of price fluctuations, visually resembling a gradually opened horn, hence the name.
Distinct Features of the Horn Pattern
1. Gradually Expanding Price Fluctuations: The price trend shows a pattern of continuously refreshed highs and persistently depressed lows, outlining a unique shape where the upper and lower boundaries expand. A complete horn pattern requires at least two higher highs and two lower lows to form.
2. Volume Characteristics: As price fluctuations become more intense, trading volume will also increase correspondingly, especially when the price breaks through key levels; the changes in volume are quite significant, reflecting the intense struggle between bulls and bears in the market.
3. Three Types
• Ascending Horn Pattern (Bearish): When it appears at the end of an upward trend, it serves as a warning bell to the market, indicating that the upward trend is about to end and a downward trend may follow.
• Descending Horn Pattern (Bullish): If it is seen at the tail end of a downward trend, it is like a ray of light in the darkness, suggesting that the market is about to hit the bottom and rebound, starting an upward journey.
• Symmetrical Horn Pattern (Neutral): This pattern does not have a clear direction, with uncertainty regarding the breakout direction, which could be either upward or downward. At this point, it is necessary to combine it with other technical indicators for a comprehensive judgment to accurately grasp the market trend.
Key Points to Note During Trading
1. Frequent False Breakouts: Due to the market being in a state of intense volatility, false breakout situations frequently occur within the horn pattern. This requires investors to be cautious during trading, avoiding easy misguidance by false signals, and making decisions only after multiple confirmations.
2. Combine with Other Indicators: To improve the accuracy of trading decisions, it is recommended to analyze the horn pattern in conjunction with commonly used technical indicators such as RSI, MACD, and trend lines. By examining the market from multiple dimensions, one can gain a more comprehensive understanding of market dynamics and reduce the risk of misjudgment.