


From the ETH price of 2082 on April 2, combined with the one-hour and four-hour structures, if viewed from another angle, an easily overlooked signal can be found:
This may not only be a starting point, but there is also a risk of forming a 'top structure'.
Four-hour level (potential risk)
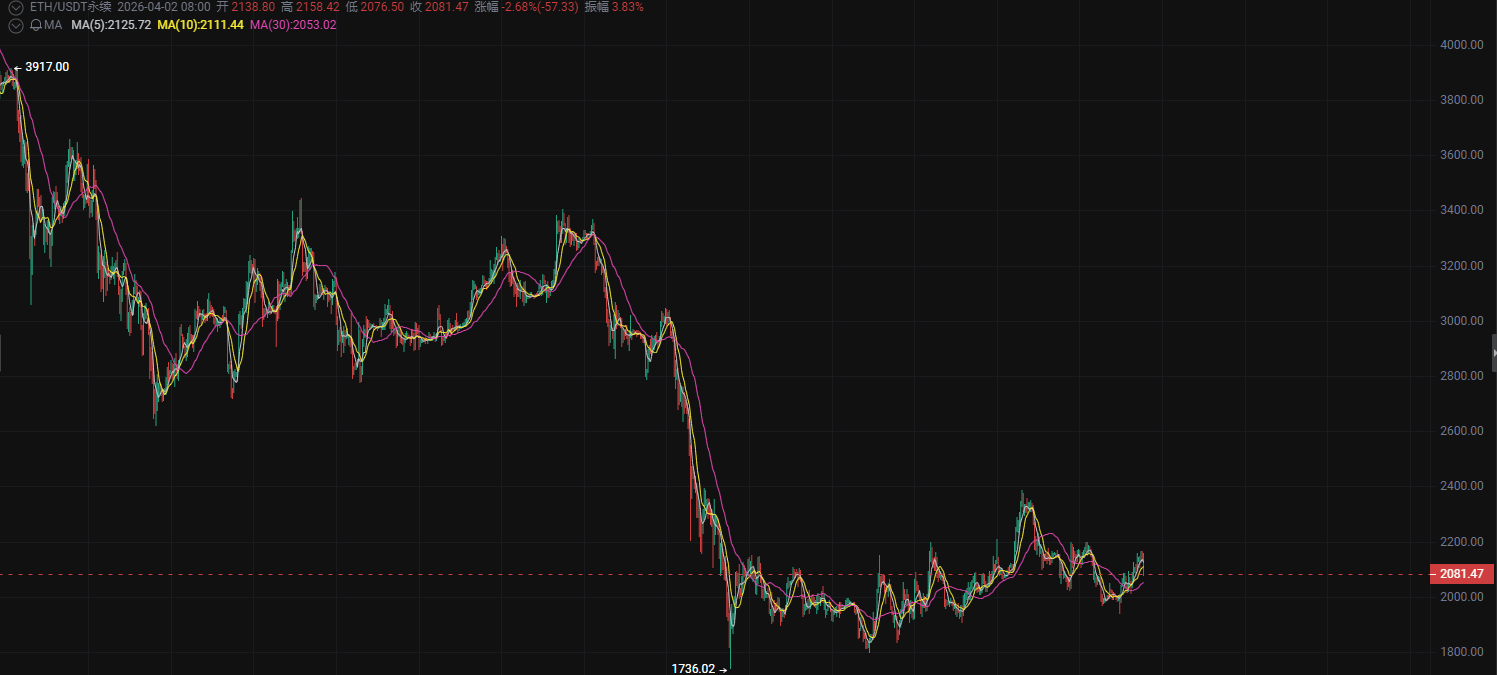
The four-hour chart is currently in a delicate position:
Although it rebounded from 2000, it has not broken through the key pressure zone (2100-2150) overall
Repeated highs without results → There is obviously selling pressure above
The pace of the rise is beginning to slow down → Momentum decay signal
Core logic:
The rebound is encountering resistance; if it cannot break through, it is likely to evolve into 'end of rebound'
Hourly timeframe (short signal)
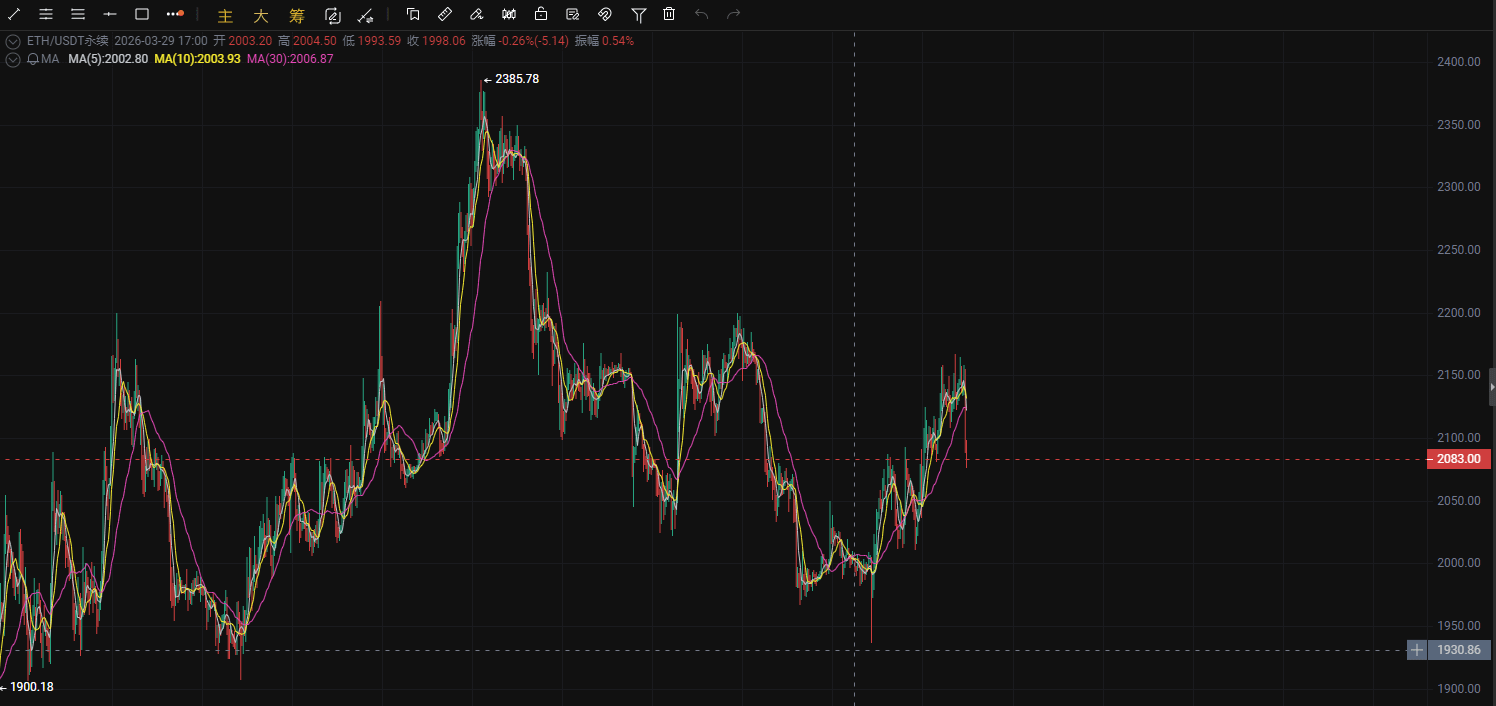
Short-term cycle already shows hidden risks:
Repeated tests of 2100 failed → forming a short-term double top / suppression structure
Trading range at the high level without making new highs → bulls lack momentum
If there is a high-volume breakdown below support → it can easily trigger a chain of stop-losses
One-sentence summary:
If it can’t go up, that itself is the most dangerous signal
Short-selling strategy (core execution)
Entry price: 2084
First take-profit: 2062
Second take-profit: 2040
Stop-loss level: 2104