After several weeks of consolidation, Ethereum $ETH is moving strongly again and is leaving interesting signals on the 4H chart.
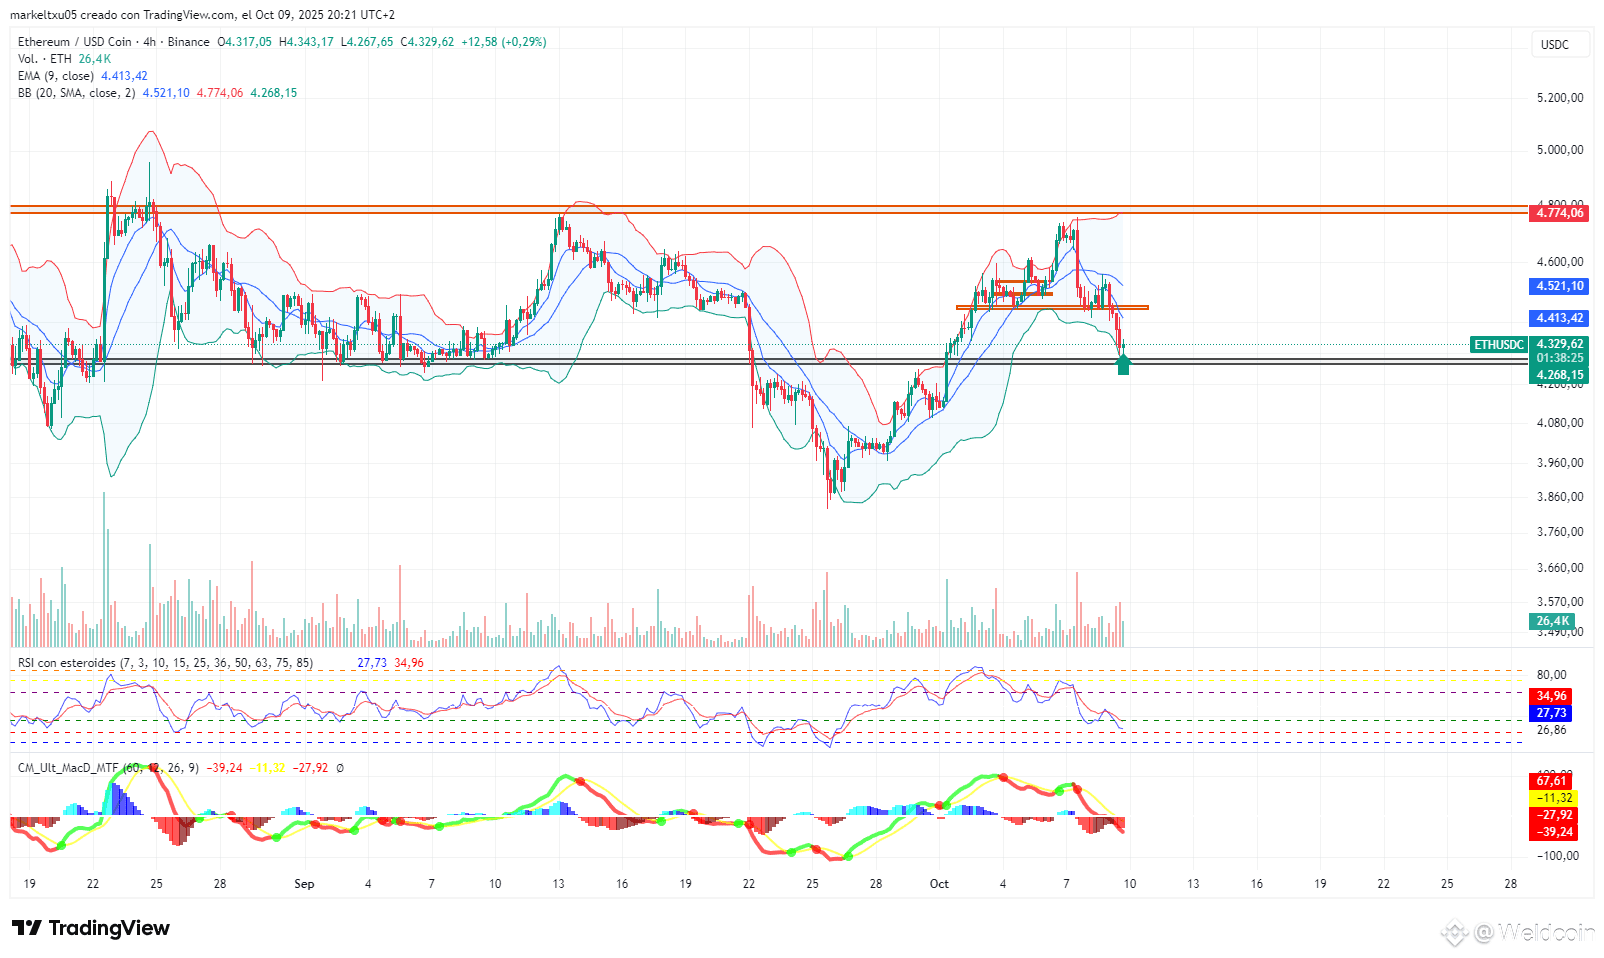
The price has retested the structural resistance of $4,770, a zone that acted as a ceiling at the end of August and early October. After the rejection, the quotation retraced towards the key support of $4,260–4,300, where it is currently trying to stabilize.
Highlighted technical aspects:
The Bollinger Bands show a widening after the drop, indicating an increase in volatility. However, the price is now at the lower band, which could anticipate a technical rebound if the current support is maintained.
The RSI on the 4H timeframe has fallen to levels close to 30, an oversold zone, which has historically coincided with short-term rebounds.
The MACD remains in negative territory but is beginning to show a loss of bearish strength — an early signal of a potential change in momentum if the histogram approaches zero.
The volume has increased in the support zone, which could indicate institutional buying interest or re-entry from traders looking for a recovery.
Possible scenarios:
Bullish rebound → If the support at $4,260 holds and we see sustained closing above $4,350, the first technical target would be at $4,500, followed by major resistance at $4,770.
Bearish breakout → If the price clearly loses the $4,260 zone, the next important support is around $4,080–4,100, where a new accumulation base could form.
In summary, Ethereum is in a decision zone: the current support can determine whether we are facing a simple correction within a larger bullish trend, or a structural change that leads the market to seek lower levels.
📈 Staying calm and observing the price reaction in the next candles will be key to confirming the direction of the next major movement.
The price has retested the structural resistance of $4,770, a zone that acted as a ceiling at the end of August and early October. After the rejection, the quotation retraced towards the key support of $4,260–4,300, where it is currently trying to stabilize.
Highlighted technical aspects:
The Bollinger Bands show a widening after the drop, indicating an increase in volatility. However, the price is now at the lower band, which could anticipate a technical rebound if the current support is maintained.
The RSI on the 4H timeframe has fallen to levels close to 30, an oversold zone, which has historically coincided with short-term rebounds.
The MACD remains in negative territory but is beginning to show a loss of bearish strength — an early signal of a potential change in momentum if the histogram approaches zero.
The volume has increased in the support zone, which could indicate institutional buying interest or re-entry from traders looking for a recovery.
Possible scenarios:
Bullish rebound → If the support at $4,260 holds and we see sustained closing above $4,350, the first technical target would be at $4,500, followed by major resistance at $4,770.
Bearish breakout → If the price clearly loses the $4,260 zone, the next important support is around $4,080–4,100, where a new accumulation base could form.
In summary, Ethereum is in a decision zone: the current support can determine whether we are facing a simple correction within a larger bullish trend, or a structural change that leads the market to seek lower levels.
📈 Staying calm and observing the price reaction in the next candles will be key to confirming the direction of the next major movement.