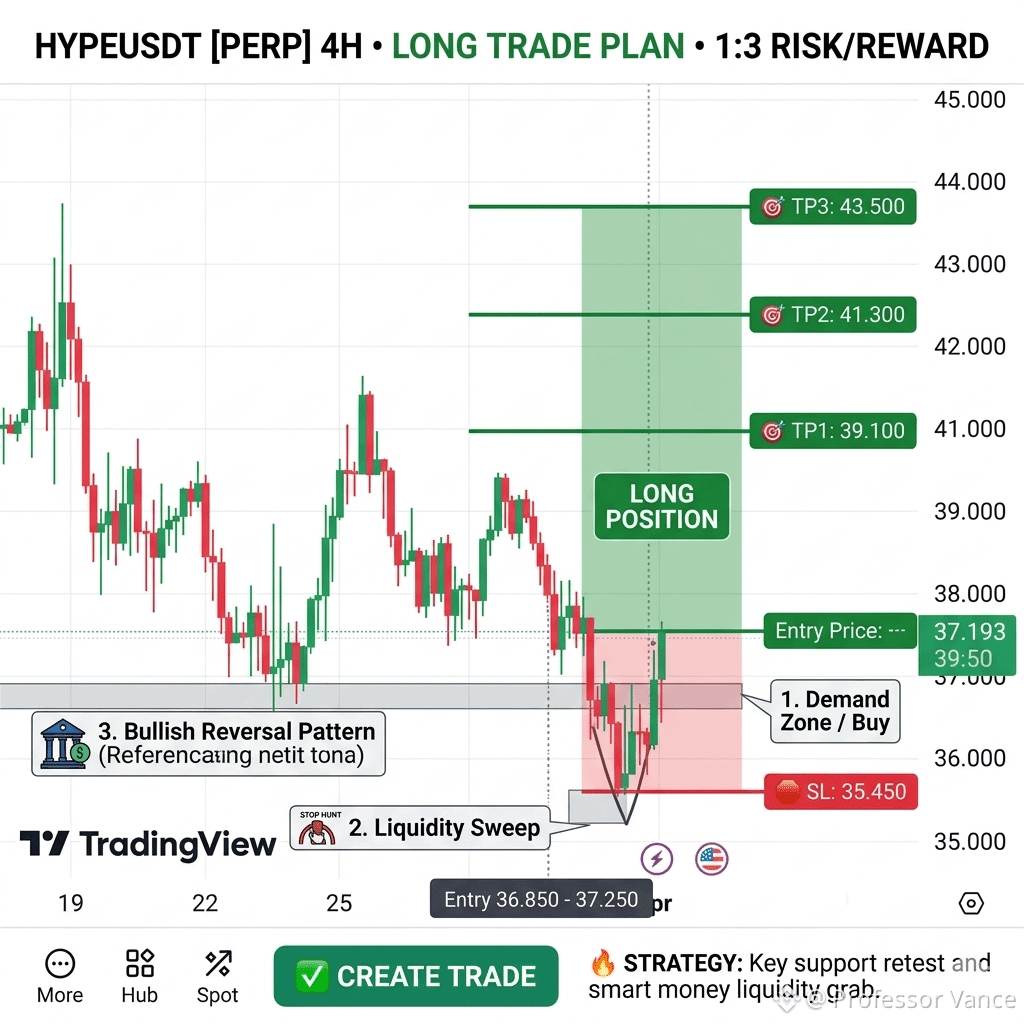
🎯 Trade Setup: $HYPE
Direction: Long 🟢
Entry Zone: 36.850 – 37.250
Stop Loss: 35.450
Take Profit 1: 39.100
Take Profit 2: 41.300
Take Profit 3: 43.500
What do you think? Will HYPE hold this support or see a deeper correction? Let me know below! 👇
📊 Market Analysis:
The 4H chart for $HYPE shows a classic corrective phase following a local peak. We are currently seeing a liquidity grab below the recent swing lows around the 36.000 mark. The price action is forming a potential "Double Bottom" or a Bullish Divergence play at this key demand zone. Market structure remains bearish in the short term (LH, LL), but we are approaching a significant institutional accumulation area where buyers historically step in.
⚡ Key Reasons:
• Demand Zone: Price is hovering near a historical support level (35.50 - 37.00).
• Liquidity Sweep: Recent stop-hunts below 36.00 indicate smart money clearing retail longs before a reversal.
• Volume: Selling pressure is exhausting as we reach lower levels.
• R/R Ratio: This setup offers an excellent risk-to-reward profile as we target the previous lower high.
📈 Pro Tip:
Always wait for a 15m or 1H candle close confirmation within your entry zone to avoid catching a falling knife!
⚠️ Disclaimer:
This is not financial advice. Always manage risk.
#HYPE #CryptoTrading #TechnicalAnalysis #BinanceSquare #TradingSignals